. 2011 Apr 6;8(57):601-8.
doi: 10.1098/rsif.2010.0445. Epub 2010 Nov 17.

Electroporation and lysis of marine microalga Karenia brevis for RNA extraction and amplification

Affiliations

Electroporation and lysis of marine microalga Karenia brevis for RNA extraction and amplification

M M Bahi et al. J R Soc Interface. .

Abstract

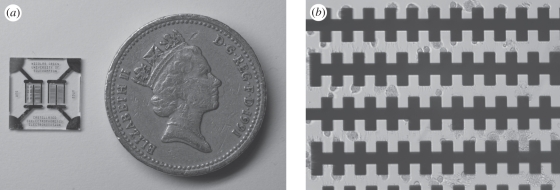
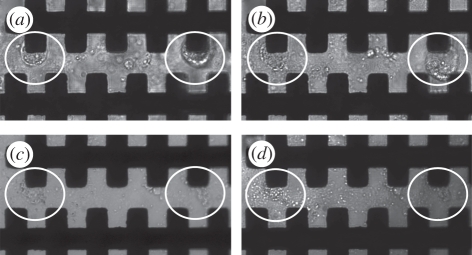
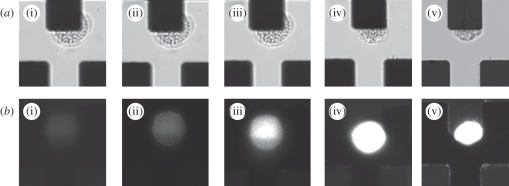
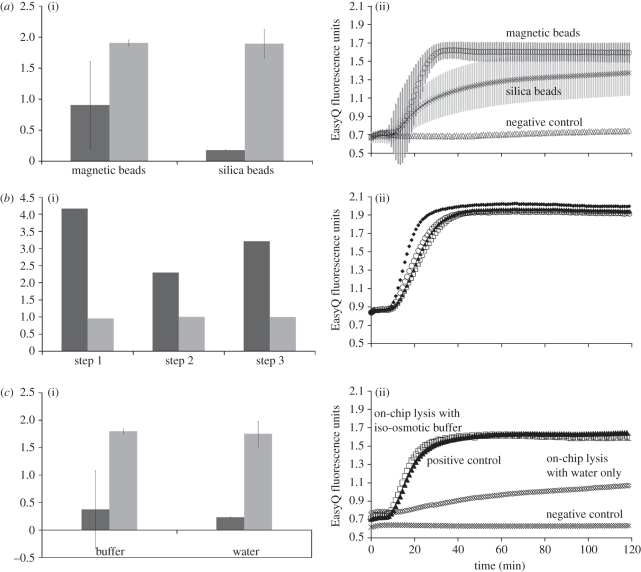
We describe here a simple device for dielectrophoretic concentration of marine microalga Karenia brevis non-motile cells, followed by electric field-mediated lysis for RNA extraction. The lysate was purified using magnetic beads and pure RNA extracted. RNA quality was assessed off-chip by nucleic acid sequence-based amplification and the optimum conditions for lysis were determined. This procedure will form part of an integrated microfluidic system that is being developed with sub-systems for performing cell concentration and lysis, RNA extraction/purification and real-time quantitative RNA detection. The integrated system and its components could be used for a large range of applications including in situ harmful algal bloom detection, transcriptomics and point-of-care diagnostics.


Figures

Figure 1.
Figure 1.
(a) Image of microchip using a UK pound coin for size reference. (b) Light microscopy image (20× magnification) of K. brevis cells captured on the micro-electrodes upon the application of 1 V at 200 kHz for 10 s.
Figure 2.
Figure 2.
Membrane deformation and pore formation of K. brevis cells: (a) pre-electroporation under cell trapping of 1 V field at 200 kHz for 20 s. Two distinct cells, encircled white, can be observed trapped on the micro-electrodes. (b) Post-electroporation of 60 V field at 600 kHz for 5 s. Membranes of the encircled cells are becoming disrupted owing to the formation of pores by the continued application of an electric field. (c) Post-electroporation of 60 V at 600 kHz for 10 s. Poration of the encircled cells is so extensive that intracellular material is escaping into the iso-osmotic low-conductivity buffer. (d) Post-electroporation of 60 V at 600 kHz for 15 s, the encircled cells have become completely disrupted and no distinct cell membranes can be observed.
Figure 3.
Figure 3.
Micrographs showing the process of single-cell electroporation of K. brevis temporary cysts. (a) Bright-field images on the application of 45 V at 600 kHz captured at (i) 0 s (ii) 30 s (iii) 1 min (iv) 1.5 min and (v) 2 min. (b) Epi-fluorescence images collected simultaneously at an excitation of 536 nm and emission of 593 nm.
Figure 4.
Figure 4.
Assessment of bench-top RNA extraction and purification methods. These data were obtained from 250 µl containing 80 000 cells, electroporated on-chip with a 30 V field at 600 kHz for 20 s: (a) comparison of extraction using magnetic and silica beads in a low-conductivity iso-osmotic buffer: (i) yield (black bars, ng µl−1) and purity (grey bars, AU), and (ii) NABSA amplification data. Error bars are the standard deviation of a triplicate experiment. The magnetic beads extraction and purification method produced RNA of comparable relative purity to the silica columns as seen in (i). However, both the yield and NASBA amplification efficiency were far better for the magnetic beads. (b) Effect of three subsequent centrifugation steps before loading the sample on the electroporation chip in low-conductivity iso-osmotic buffer: (i) yield (black bars) and relative purity (grey bars), and (ii) NABSA amplification data. Black diamonds, positive control; white circles, one centrifugation; black triangles, two centrifugations; white squares, three centrifugations. Yield and purity data are normalized to the commercial lysis buffer. The centrifugation steps appear to compromise the NASBA amplification efficiency of the extracted RNA, as seen in (ii), while yield appears to fluctuate counterintuitively with increasing centrifugation steps. (c) Effect of low-conductivity iso-osmotic buffer: (i) yield (black bars) and purity (grey bars), and (ii) NABSA amplification data. Yield and purity data are normalized to the commercial lysis buffer. Electroporation in both the low-conductivity iso-osmotic buffer and in water yielded similar quantities of RNA but more than using a commercial lysis buffer. Both had lower spectrophotometric purity. NASBA data showed RNA degradation in water resulting in a lower initial gradient.
Figure 5.
Figure 5.
Identification of optimal electroporation conditions: (a) On-chip lysis using a 1 V field for five different time intervals: (i) yield and purity results (black bars, relative yield; grey bars, relative fluorescence) and (ii) NABSA amplification data. Triangles, positive control; white circles, 1 s; crosses, 30 s; black circles, 60 s; plus symbols, 90 s; squares, 120 s. Increasing duration of electroporation led to increased yield of RNA extracted from the cell lysate. (b) On-chip lysis using a 30 V field for five different time intervals: (i) Yield and purity results (black bars, relative yield; grey bars, relative fluorescence) and (ii) NABSA amplification data. White triangles, positive control; diamonds, 1 s; squares, 30 s; crosses, 60 s; circles, 90 s; black triangles, 120 s. Electroporation that lasted longer than 60 s caused the yield of RNA extracted from the cell lysate to decrease. (c) On-chip lysis using a 60 V field for different time intervals: (i) Yield and purity results (black-filled bars, relative yield; grey-filled bars, relative fluorescence) and (ii) NABSA amplification data. Black circles, positive control; triangles, 1 s; white circles, 30 s; crosses, 60 s. Data show that electroporation of 60 V was more effective than the bench-top alternative but appeared to degrade the quality of extracted RNA from the lysate.

References

    1. Granéli E., Turner T. J. (eds) 2008. Ecology of harmful algae. Ecological studies. New York, NY: Springer
    1. Prien R. D. 2007. The future of chemical in situ sensors. Mar. Chem. 107, 422–432 10.1016/j.marchem.2007.01.014 (doi:10.1016/j.marchem.2007.01.014) - DOI
    1. Moore T. S., Mullaugh K. M., Holyoke R. R., Madison A. S., Ycel M., Luther G. W. 2009. Marine chemical technology and sensors for marine waters: potentials and limits. Ann. Rev. Mar. Sci. 1, 91–115 10.1146/annurev.marine.010908.163817 (doi:10.1146/annurev.marine.010908.163817) - DOI - PubMed
    1. Casper E. T., Patterson S. S., Bhanushali P., Farmer A., Smith M., Fries D. P., Paul J. H. 2007. A handheld NASBA analyzer for the field detection and quantification of Karenia brevis. Harmful Algae 6, 112–118 10.1016/j.hal.2006.11.001 (doi:10.1016/j.hal.2006.11.001) - DOI
    1. Ulrich R. M., Casper E. T., Campbell L., Richardson B., Heil C. A., Paul J. H. 2010. Detection and quantification of Karenia mikimotoi using real-time nucleic acid sequence-based amplification with internal control RNA (IC-NASBA). Harmful Algae 9, 116–122 10.1016/j.hal.2009.08.010 (doi:10.1016/j.hal.2009.08.010) - DOI

Publication types