

Plasticity of the reproductive axis caused by social status change in an african cichlid fish: II. testicular gene expression and spermatogenesis
- PMID: 21084443
- PMCID: PMC3219049
- DOI: 10.1210/en.2010-0876
Plasticity of the reproductive axis caused by social status change in an african cichlid fish: II. testicular gene expression and spermatogenesis
Abstract
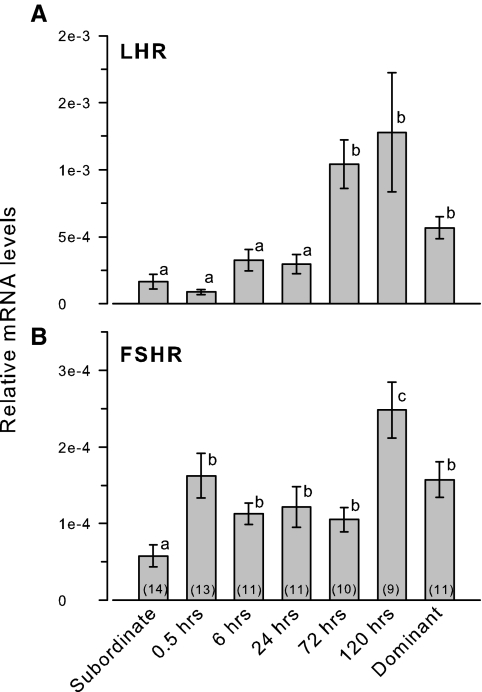
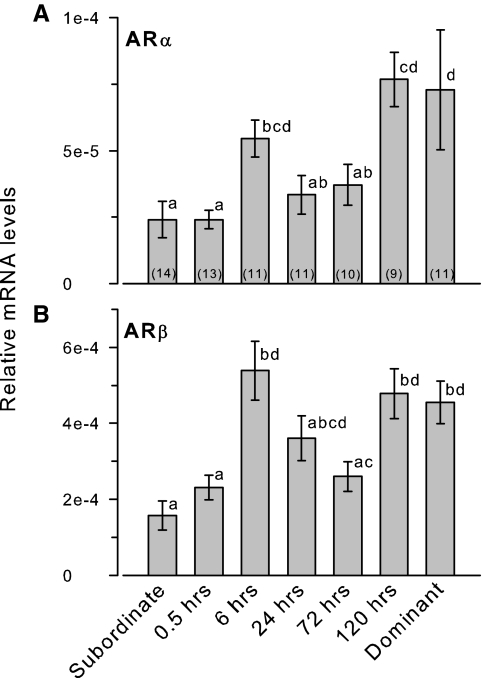
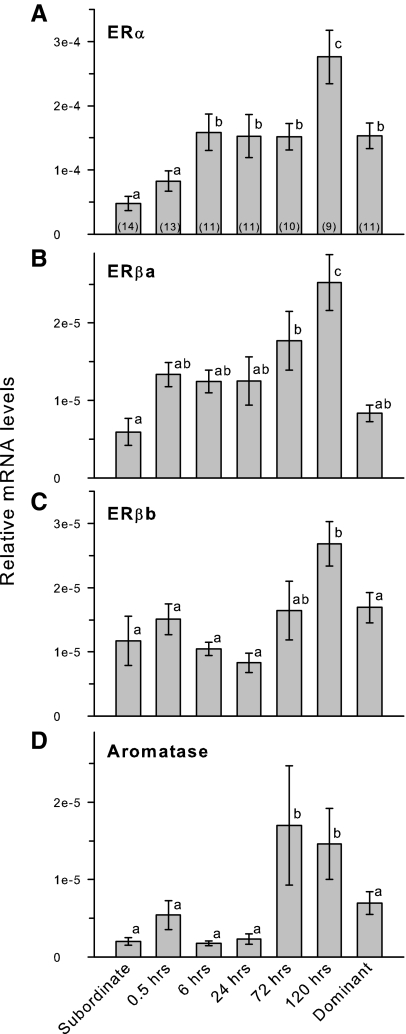
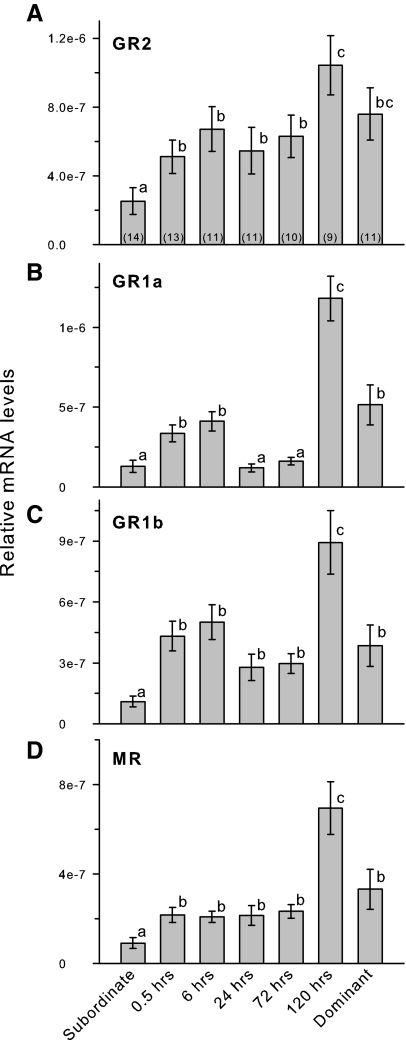
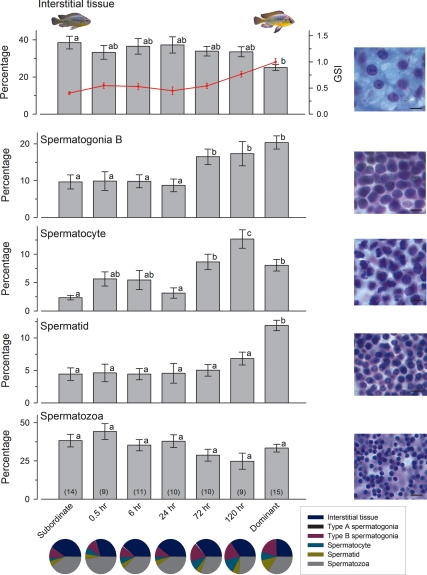
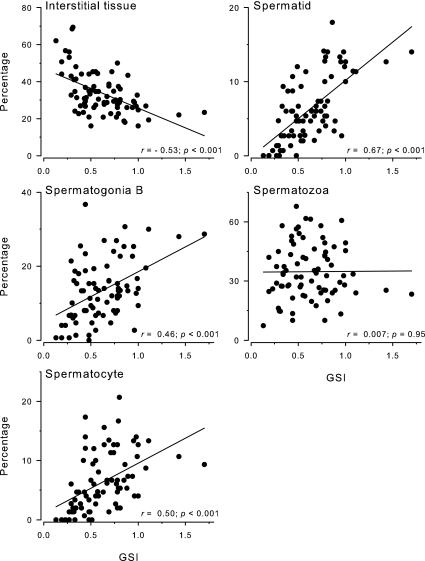
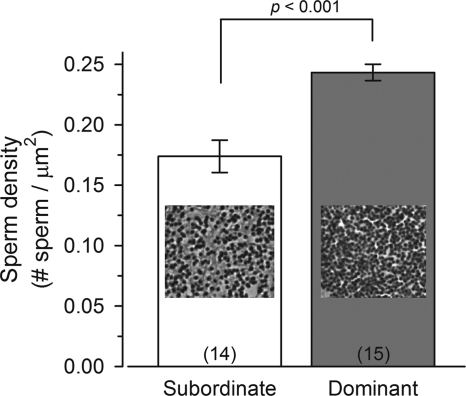
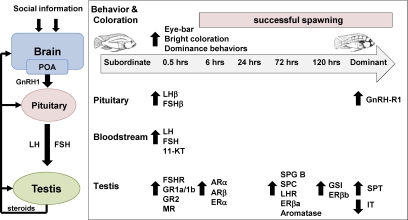
Reproduction in all vertebrates is controlled by the brain-pituitary-gonad (BPG) axis, which is regulated socially in males of the African cichlid fish Astatotilapia burtoni. Although social information influences GnRH1 neurons at the apex of the BPG axis, little is known about how the social environment and dominance affects the cellular and molecular composition of the testes to regulate reproductive capacity. We created an opportunity for reproductively suppressed males to ascend in status and then measured changes in gene expression and tissue morphology to discover how quickly the perception of this opportunity can influence the testes. Our results show rapid up-regulation of mRNA levels of FSH receptor and several steroid receptor subtypes in the testes during social ascent. In contrast, LH receptor was not elevated until 72 h after ascent, but this increase was coincident with elevated circulating androgens and early stages of spermatogenesis, suggesting a role in steroidogenesis. The spermatogenic potential of the testes, as measured by cellular composition, was also elevated before the overall increase in testes size. The presence of cysts at all stages of spermatogenesis, coupled with lower levels of gonadotropin and steroid receptors in subordinate males, suggests that the BPG axis and spermatogenesis are maintained at a subthreshold level in anticipation of the chance to gain a territory and become reproductively active. Our results show that the testis is stimulated extremely quickly after perception of social opportunity, presumably to allow suppressed males to rapidly achieve high reproductive success in a dynamic social environment.
Figures
Similar articles
-
Plasticity of the reproductive axis caused by social status change in an african cichlid fish: I. Pituitary gonadotropins.Endocrinology. 2011 Jan;152(1):281-90. doi: 10.1210/en.2010-0875. Epub 2010 Nov 10. Endocrinology. 2011. PMID: 21068157 Free PMC article.
-
Mechanistic target of rapamycin (mTOR) implicated in plasticity of the reproductive axis during social status transitions.Gen Comp Endocrinol. 2019 Oct 1;282:113209. doi: 10.1016/j.ygcen.2019.113209. Epub 2019 Jun 18. Gen Comp Endocrinol. 2019. PMID: 31226256 Free PMC article.
-
Maintenance of spermatogenesis by the activated human (Asp567Gly) FSH receptor during testicular regression due to hormonal withdrawal.Biol Reprod. 2006 May;74(5):938-44. doi: 10.1095/biolreprod.105.048413. Epub 2006 Feb 1. Biol Reprod. 2006. PMID: 16452461
-
Social regulation of male reproductive plasticity in an African cichlid fish.Integr Comp Biol. 2013 Dec;53(6):938-50. doi: 10.1093/icb/ict017. Epub 2013 Apr 23. Integr Comp Biol. 2013. PMID: 23613320 Free PMC article. Review.
-
Social Transitions Cause Rapid Behavioral and Neuroendocrine Changes.Integr Comp Biol. 2015 Aug;55(2):294-306. doi: 10.1093/icb/icv057. Epub 2015 Jun 1. Integr Comp Biol. 2015. PMID: 26037297 Free PMC article. Review.
Cited by
-
Naked mole-rat transcriptome signatures of socially suppressed sexual maturation and links of reproduction to aging.BMC Biol. 2018 Aug 2;16(1):77. doi: 10.1186/s12915-018-0546-z. BMC Biol. 2018. PMID: 30068345 Free PMC article.
-
Control of testes mass by androgen receptor paralogs in a cichlid.J Comp Physiol B. 2022 Jan;192(1):107-114. doi: 10.1007/s00360-021-01417-2. Epub 2021 Oct 13. J Comp Physiol B. 2022. PMID: 34643776
-
The dynamic nature of DNA methylation: a role in response to social and seasonal variation.Integr Comp Biol. 2014 Jul;54(1):68-76. doi: 10.1093/icb/icu034. Epub 2014 May 10. Integr Comp Biol. 2014. PMID: 24813708 Free PMC article. Review.
-
Social information changes the brain.Proc Natl Acad Sci U S A. 2012 Oct 16;109 Suppl 2(Suppl 2):17194-9. doi: 10.1073/pnas.1202552109. Epub 2012 Oct 8. Proc Natl Acad Sci U S A. 2012. PMID: 23045669 Free PMC article. Review.
-
Subordinate male cichlids retain reproductive competence during social suppression.Proc Biol Sci. 2012 Feb 7;279(1728):434-43. doi: 10.1098/rspb.2011.0997. Epub 2011 Jul 6. Proc Biol Sci. 2012. PMID: 21733892 Free PMC article.
References
-
- Sapolsky RM 2005 The influence of social hierarchy on primate health. Science 308:648–652 - PubMed
-
- Creel SN, Wildt DE, Monfort SL 2002 Behavioral and endocrine mechanisms of reproductive suppression in Serengeti dwarf mongooses. Anim Behav 43:231–245
-
- Ellis L 1995 Dominance and reproductive success among nonhuman animals: a cross-species comparison. Ethol Sociobiol 16:257–333
-
- Fernald RD 2009 Social regulation of reproduction: what changes and why? Hormones Brain Behav 1:683–691
Publication types
MeSH terms
Substances
Grants and funding
LinkOut - more resources
Full Text Sources
Miscellaneous
