

Transmission of a 2009 pandemic influenza virus shows a sensitivity to temperature and humidity similar to that of an H3N2 seasonal strain
- PMID: 21084485
- PMCID: PMC3020521
- DOI: 10.1128/JVI.02186-10
Transmission of a 2009 pandemic influenza virus shows a sensitivity to temperature and humidity similar to that of an H3N2 seasonal strain
Abstract
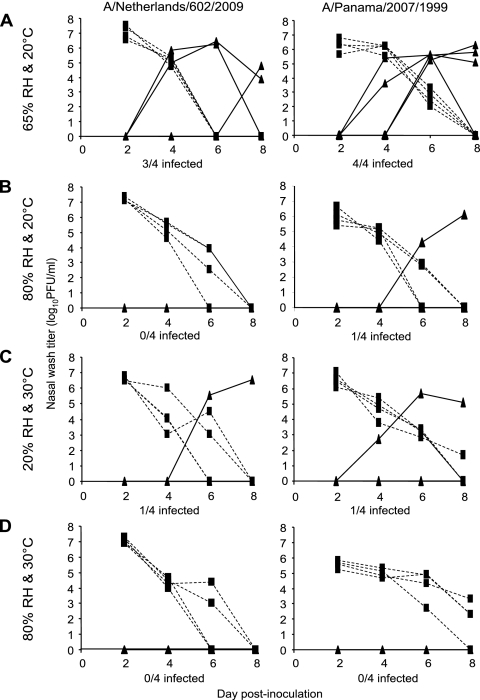
In temperate regions of the world, influenza epidemics follow a highly regular seasonal pattern, in which activity peaks in midwinter. Consistently with this epidemiology, we have shown previously that the aerosol transmission of a seasonal H3N2 influenza virus is most efficient under cold, dry conditions. With the 2009 H1N1 pandemic, an exception to the standard seasonality of influenza developed: during 2009 in the Northern Hemisphere, an unusually high level of influenza virus activity over the spring and summer months was followed by a widespread epidemic which peaked in late October, approximately 2.5 months earlier than usual. Herein we show that aerosol transmission of a 2009 pandemic strain shows a dependence on relative humidity and temperature very similar to that of a seasonal H3N2 influenza virus. Our data indicate that the observed differences in the timings of outbreaks with regard to the seasons are most likely not due to intrinsic differences in transmission between the pandemic H1N1 and seasonal H3N2 influenza viruses.
Figures
References
-
- Centers for Disease Control and Prevention. April-May 2010. FluView: a weekly influenza surveillance report prepared by the influenza division. Centers for Disease Control and Prevention, Atlanta, GA. http://www.cdc.gov/flu/weekly/. Accessed 25 September 2010.
-
- Housworth, J., and A. D. Langmuir. 1974. Excess mortality from epidemic influenza, 1957-1966. Am. J. Epidemiol. 100:40-48. - PubMed
Publication types
MeSH terms
Substances
Grants and funding
LinkOut - more resources
Full Text Sources
Medical
