Comparative Study
. 2010 Nov 17;30(46):15419-29.
doi: 10.1523/JNEUROSCI.3636-10.2010.

Low-threshold Ca2+ current amplifies distal dendritic signaling in thalamic reticular neurons

Affiliations
Comparative Study

Low-threshold Ca2+ current amplifies distal dendritic signaling in thalamic reticular neurons

Shane R Crandall et al. J Neurosci. .

Abstract

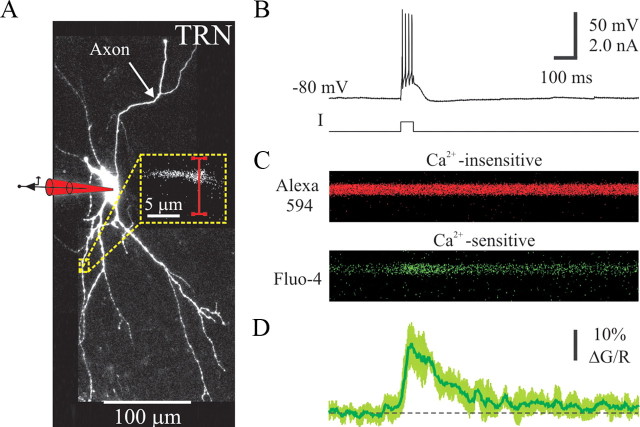
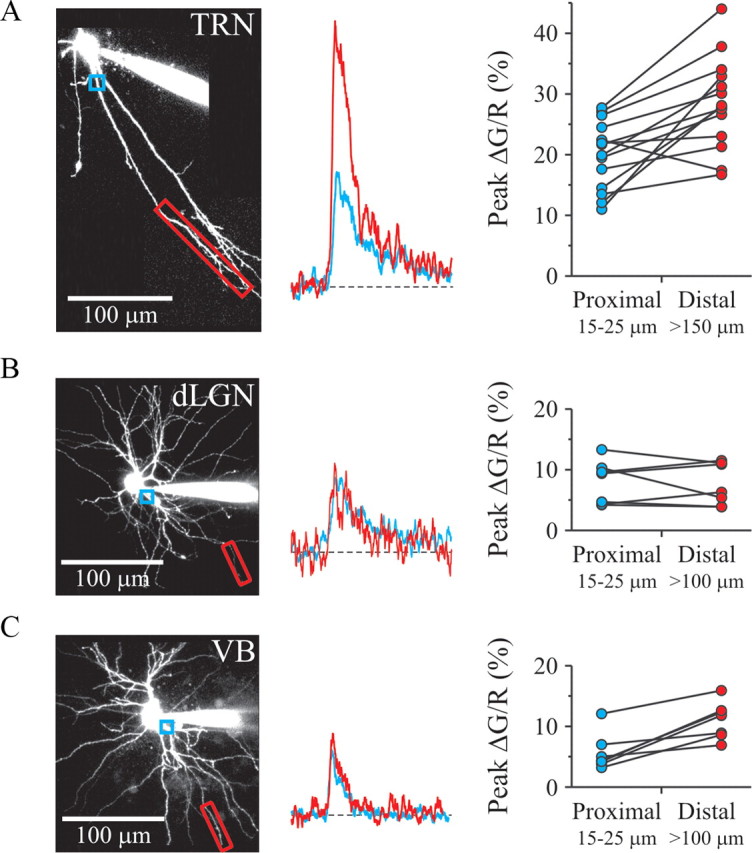
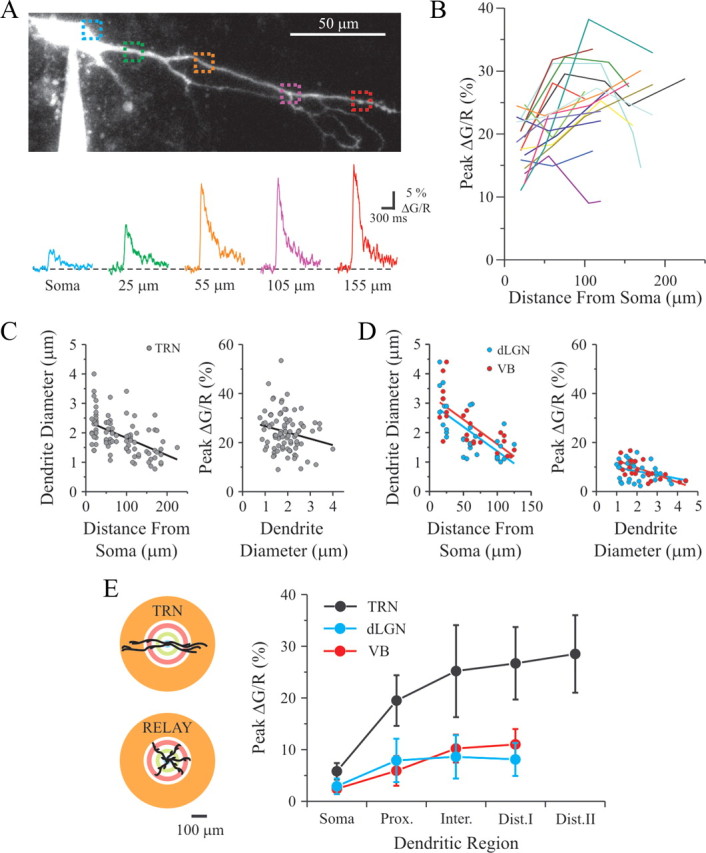
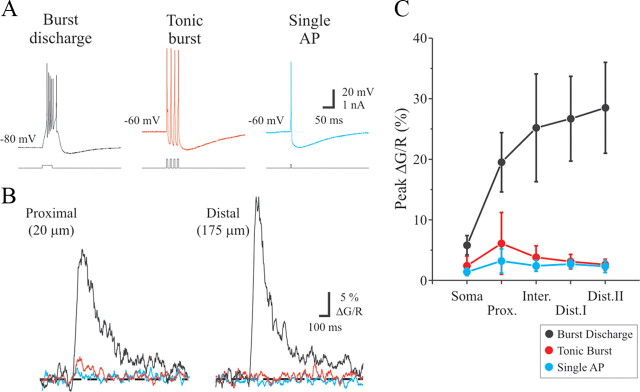
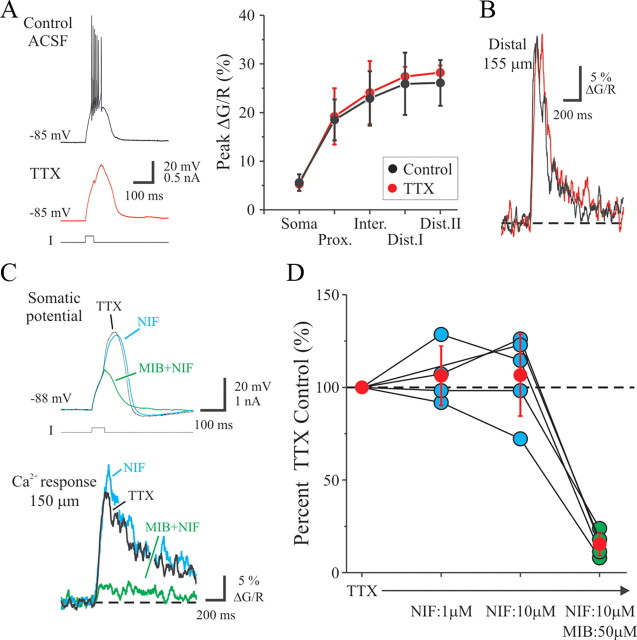
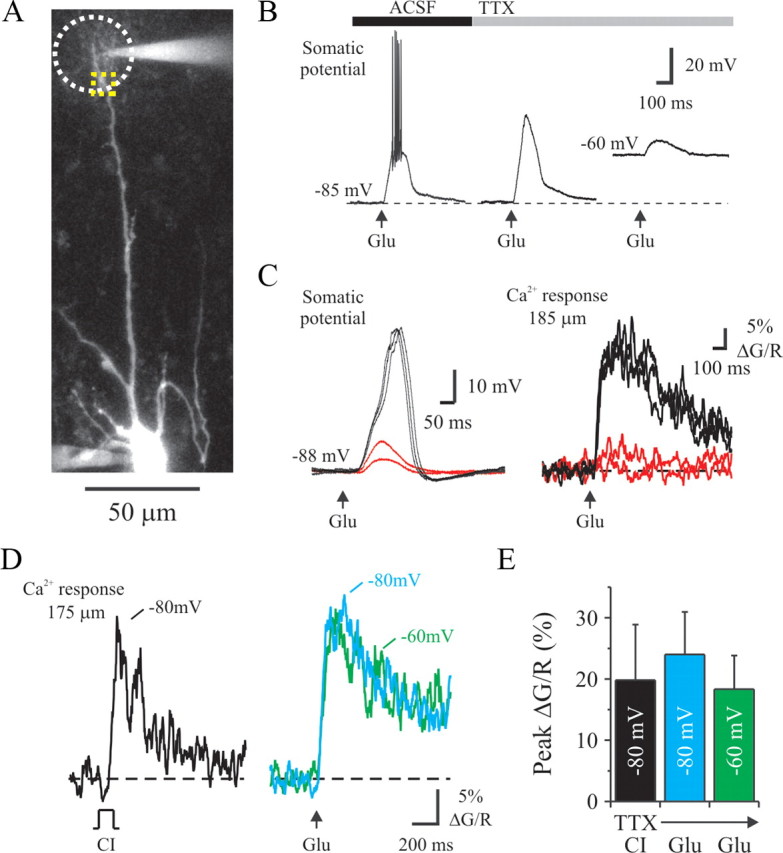
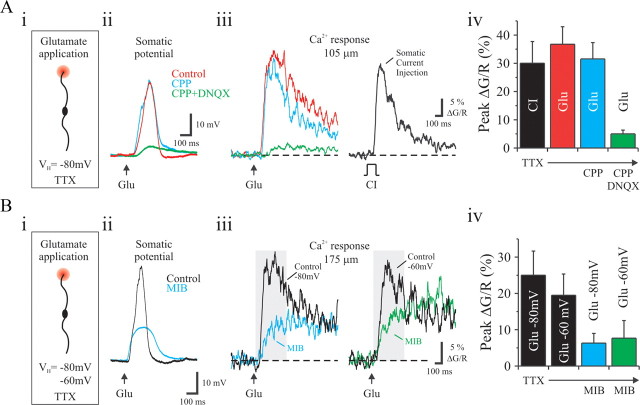
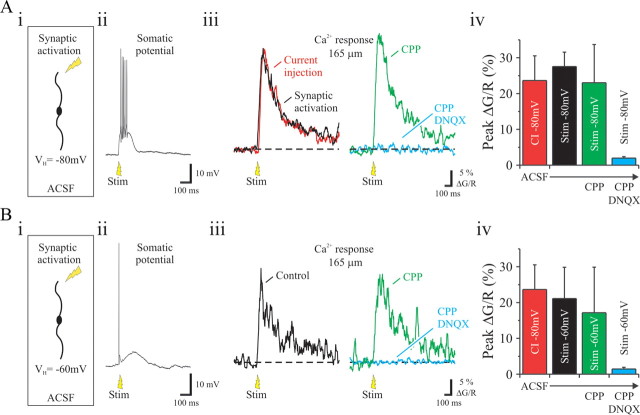
The low-threshold transient calcium current (I(T)) plays a critical role in modulating the firing behavior of thalamic neurons; however, the role of I(T) in the integration of afferent information within the thalamus is virtually unknown. We have used two-photon laser scanning microscopy coupled with whole-cell recordings to examine calcium dynamics in the neurons of the strategically located thalamic reticular nucleus (TRN). We now report that a single somatic burst discharge evokes large-magnitude calcium responses, via I(T), in distal TRN dendrites. The magnitude of the burst-evoked calcium response was larger than those observed in thalamocortical projection neurons under the same conditions. We also demonstrate that direct stimulation of distal TRN dendrites, via focal glutamate application and synaptic activation, can locally activate distal I(T), producing a large distal calcium response independent of the soma/proximal dendrites. These findings strongly suggest that distally located I(T) may function to amplify afferent inputs. Boosting the magnitude ensures integration at the somatic level by compensating for attenuation that would normally occur attributable to passive cable properties. Considering the functional architecture of the TRN, elongated nature of their dendrites, and robust dendritic signaling, these distal dendrites could serve as sites of intense intra-modal/cross-modal integration and/or top-down modulation, leading to focused thalamocortical communication.


Figures

Figure 1.
Figure 1.
Measurement of dendritic Ca2+ responses evoked by somatic burst discharge in TRN neurons. A, Stacked 2PLSM image of a TRN neuron filled. The yellow box indicates the dendritic region from which a line scan was performed (75 μm). B, Somatic recording of a burst discharge elicited from a hyperpolarized holding potential by injecting a short depolarizing current pulse. C, Simultaneous line scan of both the calcium-insensitive (Alexa Fluor 594, red) and calcium-sensitive (Fluo-4, green) fluorescent signals. D, The average ΔG/R response obtained from the dendritic region shown in A. The average (dark green line) and SD (light green envelope) were obtained from five consecutive burst discharges.
Figure 2.
Figure 2.
Burst discharge produces a robust Ca2+ response in distal dendrites of TRN neurons. A, Left, Stacked 2PLSM image of an example TRN neuron filled. The blue box indicates the dendritic region from which a proximal line scan was typically obtained (15–25 μm). The red box indicates the dendritic region from which a distal line scan was typically obtained (>150 μm). Middle, Proximal (blue) and distal (red) Ca2+ responses obtained from a different TRN neuron. Right, Population data collected from 14 dendrites. B, Left, Stacked 2PLSM image of an example dLGN neuron filled. Blue box indicates dendritic region from which a proximal line scan was typically obtained (15–25 μm). The red box indicates the dendritic region from which a distal line scan was typically obtained (>100 μm). Middle, Proximal (blue) and distal (red) Ca2+ responses obtained from a different dLGN neuron. Right, Population data collected from seven dendrites. C, Left, Stacked 2PLSM image of an example VB neuron filled. Boxes represent the same region as in B. Middle, Proximal (blue) and distal (red) Ca2+ responses obtained from a different VB neuron. Right, Population data collected from seven dendrites.
Figure 3.
Figure 3.
The TRN dendritic/Ca2+ relationship is independent of dendritic size. A, Top, Stacked 2PLSM image of an example TRN neuron filled. Boxes indicate where line scans were performed. Bottom, Corresponding Ca2+ responses obtained from the neuron above. B, Left, Plot depicts Ca2+ responses obtained along 14 different TRN dendrites as a function of dendritic distance. C, Left, Correlation between TRN dendrite diameter and measured distance from soma. Right, Correlation between the peak Ca2+ response and the measured TRN dendritic diameter. D, Left, Correlation between dendrite diameter and measured distance from soma for both dLGN (blue) and VB neurons (red). Right, Correlation between Ca2+ response and the measured dendritic diameter for both thalamocortical projection neurons. E, Left, Diagram illustrating how data were pooled based on their radial distance from soma (soma, proximal, intermediate, distal I, and distal II). Right, Plot summarizing the average response for the three different thalamic cell types (dLGN: soma, 2.9 ± 2.5%, n = 7N; proximal, 7.9 ± 4.2%, n = 11D/7N; intermediate, 8.6 ± 4.2%, n = 13D/8N; distal I, 8.1 ± 3.2%, n = 9D/6N; VB: soma, 2.4 ± 1.0%, n = 4N; proximal, 5.9 ± 2.9%, n = 8D/4N; intermediate, 10.2 ± 2.7%, n = 8D/4N; distal I, 11.0 ± 3.0%, n = 7D/4N).
Figure 4.
Figure 4.
Ca2+ responses are dependent on firing mode. A, Action potentials were discharged in one of three ways. Burst discharge (black) was evoked as previously described in Figure 1B. A single (blue) or tonic burst (red) of action potentials were evoked by holding the soma near −60 mV and injecting short (5 ms) depolarizing current pulses. A tonic burst consisted of four pulses delivered at 100 Hz. B, Ca2+ responses for each of the conditions shown in A at different distances obtained from the same dendrite. The responses shown are from the same dendrite. C, Plot summarizing the average response to burst discharge (black), tonic burst (red), and single action potential (blue). For reference, the average response to a burst discharge is shown in black.
Figure 5.
Figure 5.
TRN dendritic Ca2+ are independent of voltage-gated Na+ channels but are strongly dependent on voltage-gated T-type Ca2+ channels. A, Left, Example of a somatic recording from a TRN neuron in which a depolarizing current step evoked a burst response in control conditions (ACSF) and an LTS after TTX application (red trace). Right, Population graph illustrating the Ca2+ responses recorded at different dendritic locations produced by somatic current injection in control conditions (ACSF, black) and in TTX (red). The Ca2+ responses in TTX: soma, 5.3 ± 0.7%, n = 4N; proximal, 19.2 ± 5.8%, n = 5D/4N; intermediate, 24.1 ± 6.5%, n = 5D/4N; distal I, 27.4 ± 2.0%, n = 5D/4N; distal II, 28.2 ± 1.5%, n = 5D/5N. B, An example of a Ca2+ response obtained from the same location before (black) and after (red) TTX application. C, Top, In TTX, depolarizing current step evokes a LTS (black). Addition of nifedipine (NIF; 10 μm) slightly alters the LTS (blue); however, subsequent addition of MIB (50 μm) strongly attenuates the LTS (green). Bottom, From the same neuron, the control Ca2+ response (TTX, black) is slightly changed in the presence of nifedipine (blue) but is almost completely blocked by mibefradil (green). D, Population data for five different distal dendrites (>150 μm) obtained from different TRN neurons. The Ca2+ responses are standardized to the response obtained in TTX, and the red data points indicate the mean ± SD.
Figure 6.
Figure 6.
Focal glutamate application onto a distal dendrite evokes local Ca2+ current independent of the soma/proximal dendrites. A, Stacked 2PLSM image of a TRN neuron filled and pressure-ejection pipette near a distal dendrite (185 μm). The pipette contained glutamate (0.5–1 mm in ACSF) and Alexa Fluor 594 (12.5 μm), the latter aiding in the placement of the pipette and estimating the spread of glutamate ejection, which is represented by the white-dotted line (∼15–20 μm radius). Line scans were performed near the edge of the stimulated area (yellow box). B, Glutamate application (Glu) to distal dendrite produced a burst discharge recorded at the soma in control conditions (ACSF). In TTX (0.5 μm), glutamate produced an LTS when the cell was initially held at −85 mV, but when the cell was depolarized (−60 mV), the same stimulation produced a small transient depolarization (EPSP-like). C, Left, Somatic response to five separate glutamate applications with different puff intensities (0.75–3 psi, 50 ms duration). Right, Corresponding Ca2+ responses recorded near the glutamate pipette. Two subthreshold (red) and three suprathreshold (black) responses are shown. D, Examples of Ca2+ responses measured at a distal dendrite (175 μm) in the presence of TTX resulting from somatic current injection (CI; black trace) and distal glutamate application. The latter Ca2+ responses depict glutamate-evoked responses when the soma was held at either −80 mV (blue) or −60 mV (red). E, The plot illustrates the amplitude of the glutamate-evoked responses in these two conditions (−85 or −60 mV at soma) relative to the Ca2+ responses evoked by somatic current injection.
Figure 7.
Figure 7.
Characterization of glutamate-evoked distal Ca2+ signals. Ai, Experimental design consisted of applying glutamate (Glu) to an individual distal TRN dendrite while holding the soma at −80 mV in a bath solution that contained TTX (0.5 μm). Aii, Glutamate-evoked response recorded at the soma before (Control) and after CPP or CPP + DNQX application. Aiii, Left, In the same cell as Aii, the corresponding glutamate-evoked Ca2+ response imaged at a distal location. Right, For reference, an LTS Ca2+ response evoked by a somatic current injection (CI) is shown. Aiv, Average amplitude of the Ca2+ response for each of the four conditions tested are plotted. Bi, Experimental design consisted of applying glutamate (Glu) to an individual distal TRN dendrite while holding the soma at either −80 or −60 mV in a bath solution that contained TTX (0.5 μm). Bii, Glutamate-evoked response recorded at the soma while holding at −80 mV before (Control) and after mibefradil (MIB; 50 μm) application. Biii, Control trace (black) is the response to distal glutamate application in presence of TTX (left, −80 mV; right, −60 mV). After the addition of mibefradil, the subsequent Ca2+ responses to glutamate application are significantly reduced. Peak Ca2+ responses for this experiment were measured within the gray box. Biv, Average amplitude of the Ca2+ response for each of the four conditions tested are plotted.
Figure 8.
Figure 8.
Characterization of synaptic-evoked distal Ca2+ signals. Ai, Experimental design consisted of stimulating the internal capsule using a single stimulus (Stim) while holding TRN neurons the soma at −80 in a control ACSF bath solution. Aii, Somatic recording of a synaptically evoked burst discharge while holding at −80 mV. Aiii, Left, Distal Ca2+ response evoked by synaptic stimulation of the internal capsule (black). For reference, a control (red) response to a somatic current injection (CI) is also shown. Right, Resulting synaptically evoked Ca2+ responses after the bath application of CPP (green) and CPP + DNQX (blue). Aiv, Average amplitude of the Ca2+ response for each of the four conditions tested are plotted. Bi, Experimental design consisted of stimulating the internal capsule using a single stimulus (Stim) while holding TRN neurons the soma at −60 mV in a control ACSF bath solution. Bii, Somatic recording of a synaptically evoked burst discharge while holding at −60 mV. Biii, Left, A single Ca2+ response (black) evoked by synaptic stimulation of the internal capsule. Subsequent Ca2+ responses after bath application of CPP (green) and CPP + DNQX (blue). Biv, Average amplitude of the Ca2+ response for each of the four conditions tested are plotted.

References

    1. Avanzini G, de Curtis M, Panzica F, Spreafico R. Intrinsic properties of nucleus reticularis thalami neurones of the rat studied in vitro. J Physiol. 1989;416:111–122. - PMC - PubMed
    1. Brunton J, Charpak S. Heterogeneity of cell firing properties and opioid sensitivity in the thalamic reticular nucleus. Neuroscience. 1997;78:303–307. - PubMed
    1. Contreras D, Curró Dossi R, Steriade M. Bursting and tonic discharges in two classes of reticular thalamic neurons. J Neurophysiol. 1992;68:973–977. - PubMed
    1. Contreras D, Curró Dossi R, Steriade M. Electrophysiological properties of cat reticular thalamic neurones in vivo. J Physiol. 1993;470:273–294. - PMC - PubMed
    1. Coulter DA, Huguenard JR, Prince DA. Calcium currents in rat thalamocortical relay neurones: kinetic properties of the transient, low-threshold current. J Physiol. 1989;414:587–604. - PMC - PubMed

Publication types

Substances

LinkOut - more resources