Comparative Study
. 2010 Nov 17;30(46):15546-57.
doi: 10.1523/JNEUROSCI.2380-10.2010.

Motor and dorsal root ganglion axons serve as choice points for the ipsilateral turning of dI3 axons

Affiliations
Comparative Study

Motor and dorsal root ganglion axons serve as choice points for the ipsilateral turning of dI3 axons

Oshri Avraham et al. J Neurosci. .

Abstract

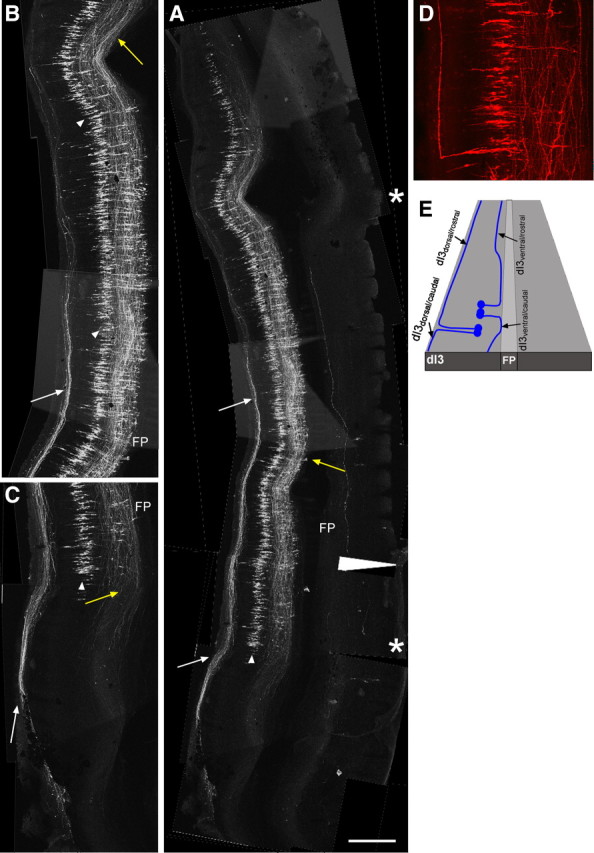
The axons of the spinal intersegmental interneurons are projected longitudinally along various funiculi arrayed along the dorsal-ventral axis of the spinal cord. The roof plate and the floor plate have a profound role in patterning their initial axonal trajectory. However, other positional cues may guide the final architecture of interneuron tracks in the spinal cord. To gain more insight into the organization of specific axonal tracks in the spinal cord, we focused on the trajectory pattern of a genetically defined neuronal population, dI3 neurons, in the chick spinal cord. Exploitation of newly characterized enhancer elements allowed specific labeling of dI3 neurons and axons. dI3 axons are projected ipsilaterally along two longitudinal fascicules at the ventral lateral funiculus (VLF) and the dorsal funiculus (DF). dI3 axons change their trajectory plane from the transverse to the longitudinal axis at two novel checkpoints. The axons that elongate at the DF turn at the dorsal root entry zone, along the axons of the dorsal root ganglion (DRG) neurons, and the axons that elongate at the VLF turn along the axons of motor neurons. Loss and gain of function of the Lim-HD protein Isl1 demonstrate that Isl1 is not required for dI3 cell fate. However, Isl1 is sufficient to impose ipsilateral turning along the motor axons when expressed ectopically in the commissural dI1 neurons. The axonal patterning of dI3 neurons, revealed in this study, highlights the role of established axonal cues-the DRG and motor axons-as intermediate guidepost cues for dI3 axons.


Figures

Figure 1.
Figure 1.
Characterization of dI3 enhancers. 215, 586, and 242 enhancer elements were cloned upstream to Cre recombinase and electroporated with a conditional nGFP (CAGG-loxP-STOP-loxP-nGFP) (A–E). 215 enhancer was cloned upstream to Gal4 and electroporated with 242::Cre and a double-conditional GFP plasmid (UAS::loxP-STOP-loxP-GFP) (F, G). Chick embryos were electroporated at stage 16 and fixed at E4. Cross sections of electroporated neural tube were stained with interneuron-specific antibodies. The images on the left show the entire neural tube and the adjacent images are high magnifications of the boxed areas, which show the dorsal neural tube stained with the indicated antibodies. In A and B, the yellow arrows point to MNs, the arrowheads to roof plate cells, and the white arrow to dI3 neurons. In C, the yellow arrows point to dI2 neurons and the white arrows to dI3 neurons. In D, the yellow arrows point to dI1 neurons and the white arrows to dI3 neurons. In E, the white arrows point to dI2 neurons. In F and G, the white arrows point to dI3 neurons. The ratio of labeled interneurons to the total GFP-positive cells for each enhancer and enhancer combination is indicated in H. MNs are the ventral Isl1+ cells. dI3 are the dorsal Isl1+ cells. dI2 are the Lhx1/5+/Pax2 cells, dI1 are the Lhx2/9+ cells, and RP cells are the dorsal midline cells. Scale bar in G is 250 μm for images of the entire neural tube (left side) and 50 μm for the magnifications.
Figure 2.
Figure 2.
Axonal projection pattern of dI3 neurons. Chick embryos were electroporated at stage 16 (left side) with EdI3 enhancers along with a Cre/Gal4 GFP plasmid (215::Gal4 + 242::Cre + UAS-LoxP-STOP-LoxP-GFP). Spinal cords were removed at E6, fixed, and analyzed as open-book preparations. Whole neural tubes (sacral to cervical) are presented (A). Confocal images were taken and photomerged using Photoshop software. High-power magnification of the thoracic (B) and sacral (C) levels are shown. A single dI3 neuron projecting toward the dorsal midline and turning rostrally is shown in D. The scheme in E illustrates the axonal projection pattern of the dI3 neuronal population. Rostral is up in the image and scheme. The arrowheads point to the cell bodies of dI3 neurons. The yellow arrows point to the ventral longitudinal fascicule at the VLF. The white arrows point to the dorsal longitudinal fascicule at the DF. The asterisk represents the level of the limbs. FP, Floor plate. Scale bar is 300 μm for A, 200 μm for B and C, and 150 μm for D.
Figure 3.
Figure 3.
dI3 axons turn along the axons of motor and DRG neurons. Chick embryos were electroporated as in Figure 2 and analyzed in cross sections at E5 (A) and E6 (B–D). The BEN antibody, which labels motor axons, floor plate cells, and DRG axons, was used to label motor axons (A–C). Anti-axonin antibody was used to label the axons of DRG neurons and the DREZ (D). A scheme demonstrating the axonal turning points of dI3 axons is presented in E. High-power magnifications of the boxed regions in A–D are shown in A′, B′, B″, C′, C″, C‴, D′, and D″. In A and B, the white arrows point to the initial dorsoventral projection of dI3ventral axons. The yellow arrows point to the medial-to-lateral turn of dI3ventral axons. The arrowheads point to the longitudinal turn of dI3ventral axons. In C, the yellow arrows point to dI3ventral axons at the dorsal and ventral margins of the VLF and the white arrows point to dI3dorsal axons within the afferent fascicule at the DF. In D, the white arrows point to the longitudinal turn of dI3dorsal axons. Scale bar in D is 300 μm for A, 100 μm for A′, B′, and B″, 150 μm for B, 150 μm for C, 75 μm for C′, C″, and C‴, 170 μm for D, and 75 μm for D′ and D″.
Figure 4.
Figure 4.
Double labeling of dI1 and dI3 axons reveals the topographic arrangement of the dorsal IN. Plasmid combinations that differentially label dI1 and dI3 neurons were used: 215::Gal4 + UAS::GFP and EdI1::Cre + pCAGG-LoxP-STOP-LoxP-taumyc for A; and 215::Gal4 + 242::Cre + UAS::LoxP-STOP-LoxP-GFP and EdI1::PhiC31o + pCAGG-AttB-STOP-AttP-taumyc for B. Magnification of the boxed areas in A and B are shown in A′ and B′. Yellow arrows point to the longitudinal fascicules of dI3 axons. White arrows point to the longitudinal fascicules of dI1 axons. A scheme that demonstrates the location of the dI1–3 neurons and axons is shown in C. FP, Floor plate. Scale bar is 300 μm for A, 200 μm for A′ and B, and 100 μm for B′.
Figure 5.
Figure 5.
Isl1 represses Lhx1/5 and Lhx2/9 without altering IN cell fate. A, C, Isl1 and Lhx9 cross-repress each other. B, D, Isl1 and Lhx1 cross-repress each other. The images on the left show overlapping between electroporated cells and Lim-HD-positive neurons. The images on the right show the Lim-HD channel. E–H, For quantification, the number of cells coexpressing the electroporated gene and the endogenous Lim-HD protein at the electroporated side and the number of cells expressing the endogenous Lim-HD protein at the control side were counted. The box plots show the ratio between them. Comparing each experimental group to the control (nGFP) using Dunnett's method (which takes into account multiple comparisons) shows a significant difference between the control group and the experimental groups. The circle charts show the significance of these results. No overlapping between the control group (green circle) and the experimental groups (black circles) is indicative of p values <0.05. Scale bar in D is 200 mm.
Figure 6.
Figure 6.
Ectopic expression of Isl1 does not alter neuronal cell fate. Ectopic Isl1 does not change the pattern of Brn3a (A), Pax2 (B), and Tlx3 (C). The images on the left show the overlapping between the electroporated cells and the cell fate marker-positive neurons. The images on the right show the cell fate marker channel. Scale bar in C is 200 mm.
Figure 7.
Figure 7.
Isl1 is not required for dI3 cell fate. Cross sections of an E11.5 embryo of Isl1hypo (F–J) and littermate E11.5 embryo (A–E) were stained with antibodies to Brn3a (A, F), Tlx3 (A–C, F–H), Isl1 (B, G), Lhx1/5 (C, H), and Lhx9 (E, J); and with mRNA probe for Pax2 (D, I). A–J are entire neural tube images, A′–J′ are magnifications of the dorsal half of hemineural tubes. Sections were triple stained with Brn3a, Tlx3, and Isl1. Isl1 is not expressed in the dorsal neural tube of Isl1hypo (compare B and B′ to G and G′). No change is evident in the expression pattern of Brn3a, Tlx3, Lhx1, Pax2, or Lhx9. Scale bar in F is 300 μm for A–J and 150 μm for A′– J′.
Figure 8.
Figure 8.
Ectopic Isl1 instructs a lateral turning to the commissural dI1 axons at the motor neuron choice point. Isl1-IRES-taumyc (C, E, G) and GFP (A, D, F) were expressed in dI1 neurons using the Cre/LoxP and EdI1 enhancers. GFP was expressed in dI3 neurons (B) as described in Figure 2. In D, the yellow arrow points to dI1comm and the green arrow to dI1ipsi. In E, the yellow arrows point to the ventral projection, the white arrows point to the laterally turning dI1Isl/taumyc axons, and the arrowheads point to the longitudinally turning dI1Isl/taumyc axons. The insets in E show the entire neural tube, while the image shows the ventral lateral side of the electroporated side. At E6, the ipsilateral projection of dI1ipsi is apparent (F, green arrows). Ectopic expression of Isl1 in dI1 neurons does not change the projection pattern of dI1ipsi (G). dI1ipsi axons are projected laterally (green arrow in G) and dorsally to the motor neuron (G, stained with BEN antibody). The percent of axons crossing to the contralateral side from the total axons is shown in H. The area occupied by the axons at the ipsilateral and contralateral sides of electroporated open-book preparations was measured using ImageJ software. Three open books for each group, and 3–4 different levels from each open book, were measured. The Wilcoxon/Kruskal–Wallis test revealed a significant difference between the groups (p < 0.001). A scheme that demonstrates the axonal projection patterns of dI1, dI3, and dI1Isl1 neurons is presented in I. Scale bar in B is 300 mm for A, 350 μm for B, 250 μm for C, 300 μm for D, 150 μm for E, and 200 μm for F and G.

Similar articles

Cited by

References

    1. Alvarez FJ, Jonas PC, Sapir T, Hartley R, Berrocal MC, Geiman EJ, Todd AJ, Goulding M. Postnatal phenotype and localization of spinal cord V1 derived interneurons. J Comp Neurol. 2005;493:177–192. - PMC - PubMed
    1. Augsburger A, Schuchardt A, Hoskins S, Dodd J, Butler S. BMPs as mediators of roof plate repulsion of commissural neurons. Neuron. 1999;24:127–141. - PubMed
    1. Avraham O, Hadas Y, Vald L, Zisman S, Schejter A, Visel A, Klar A. Transcriptional control of axonal guidance and sorting in dorsal interneurons by the Lim-HD proteins Lhx9 and Lhx1. Neural Dev. 2009;4:21. - PMC - PubMed
    1. Avraham O, Zisman S, Hadas Y, Vald L, Klar A. Deciphering axonal pathways of genetically defined groups of neurons in the chick neural tube utilizing in ovo electroporation. J Vis Exp. 2010;1792 - PMC - PubMed
    1. Bourikas D, Pekarik V, Baeriswyl T, Grunditz A, Sadhu R, Nardó M, Stoeckli ET. Sonic hedgehog guides commissural axons along the longitudinal axis of the spinal cord. Nat Neurosci. 2005;8:297–304. - PubMed

Publication types