Comparative Study
. 2010 Nov 17;30(46):15585-99.
doi: 10.1523/JNEUROSCI.2871-10.2010.

Orexin/hypocretin modulates response of ventral tegmental dopamine neurons to prefrontal activation: diurnal influences

Affiliations
Comparative Study

Orexin/hypocretin modulates response of ventral tegmental dopamine neurons to prefrontal activation: diurnal influences

David E Moorman et al. J Neurosci. .

Abstract

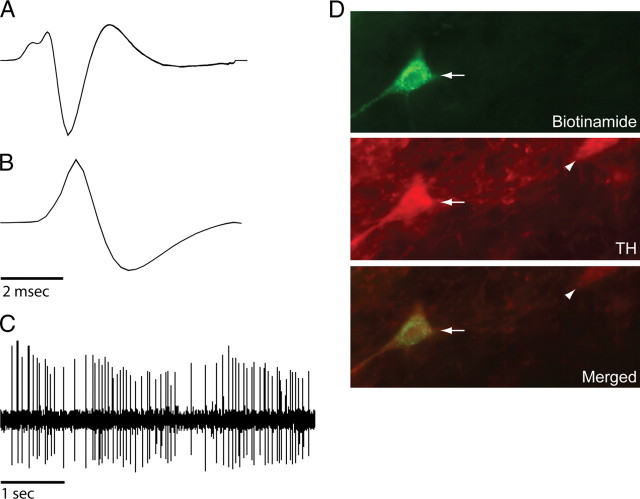
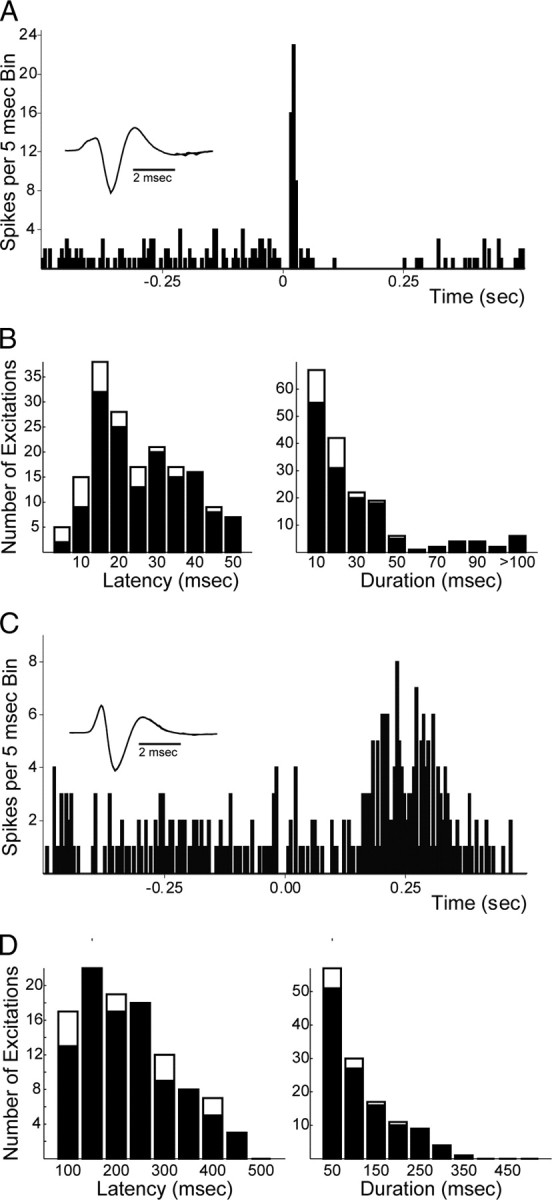
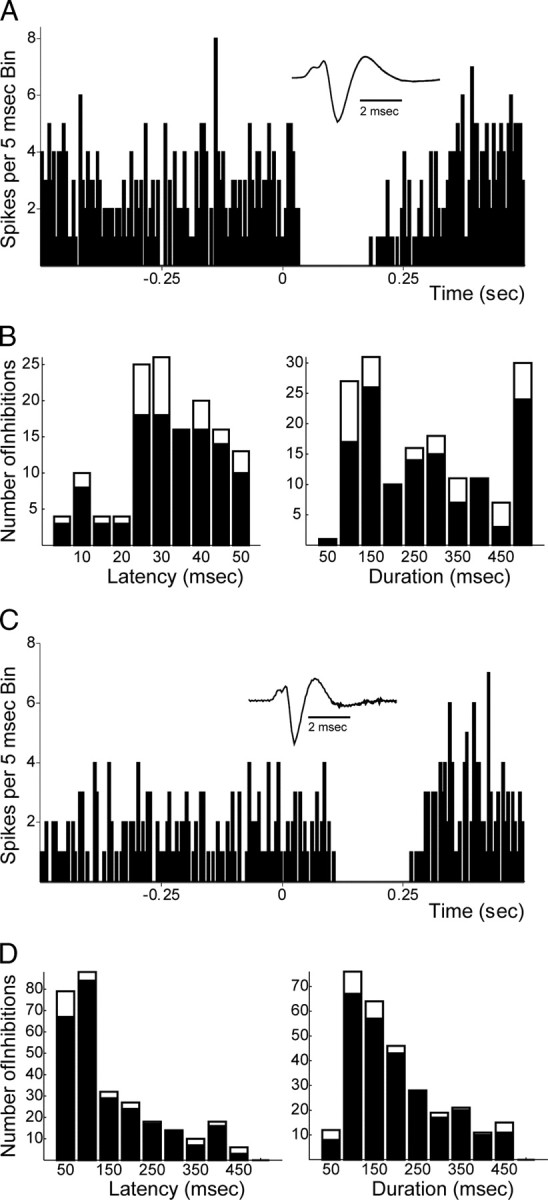
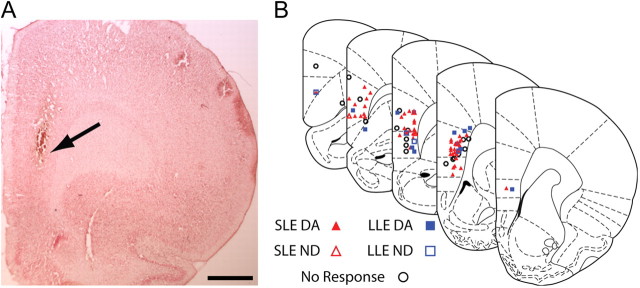
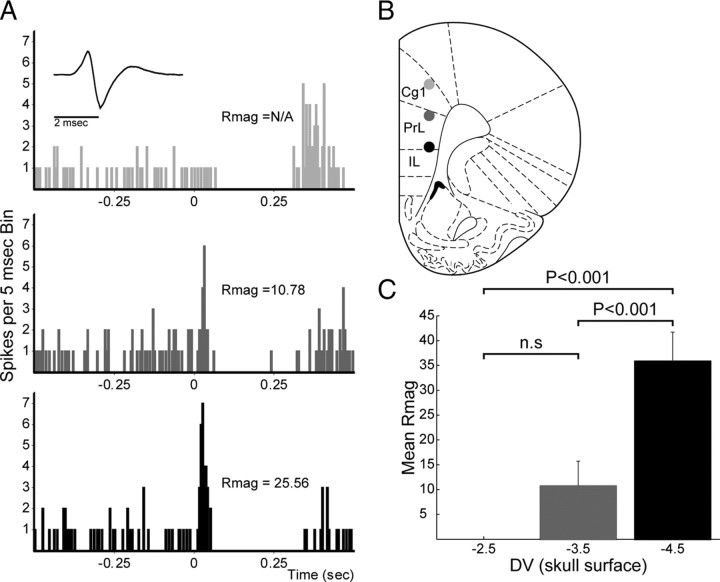
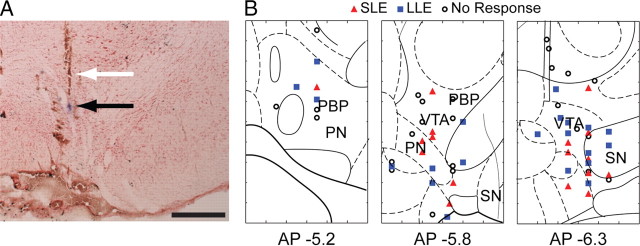
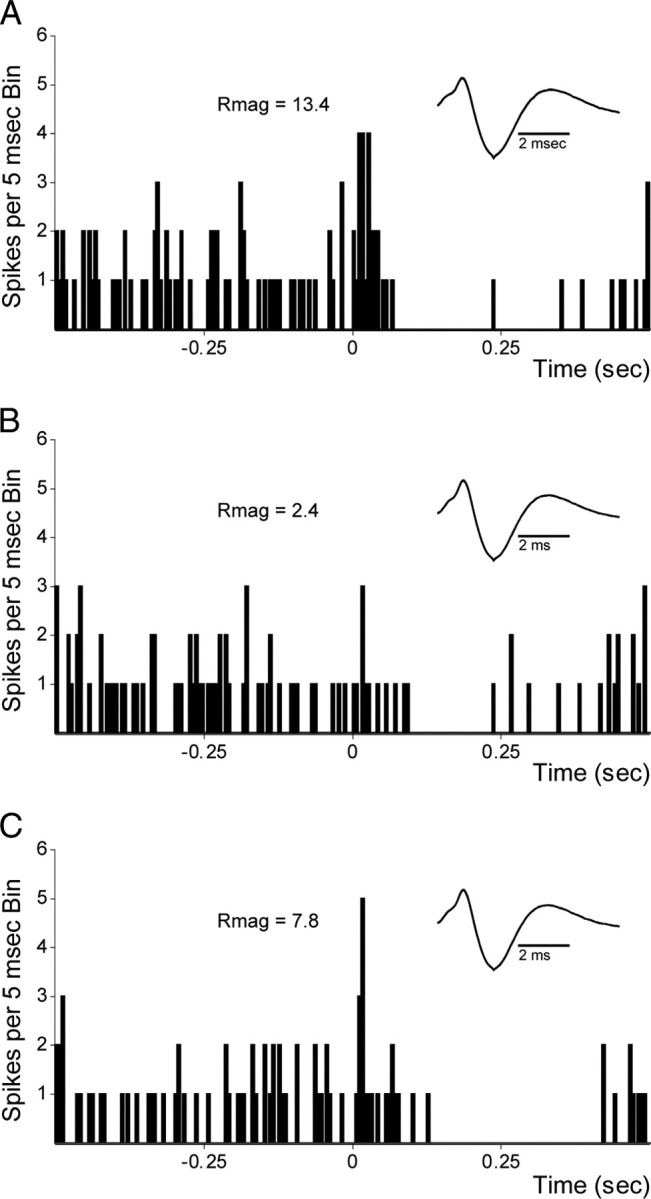
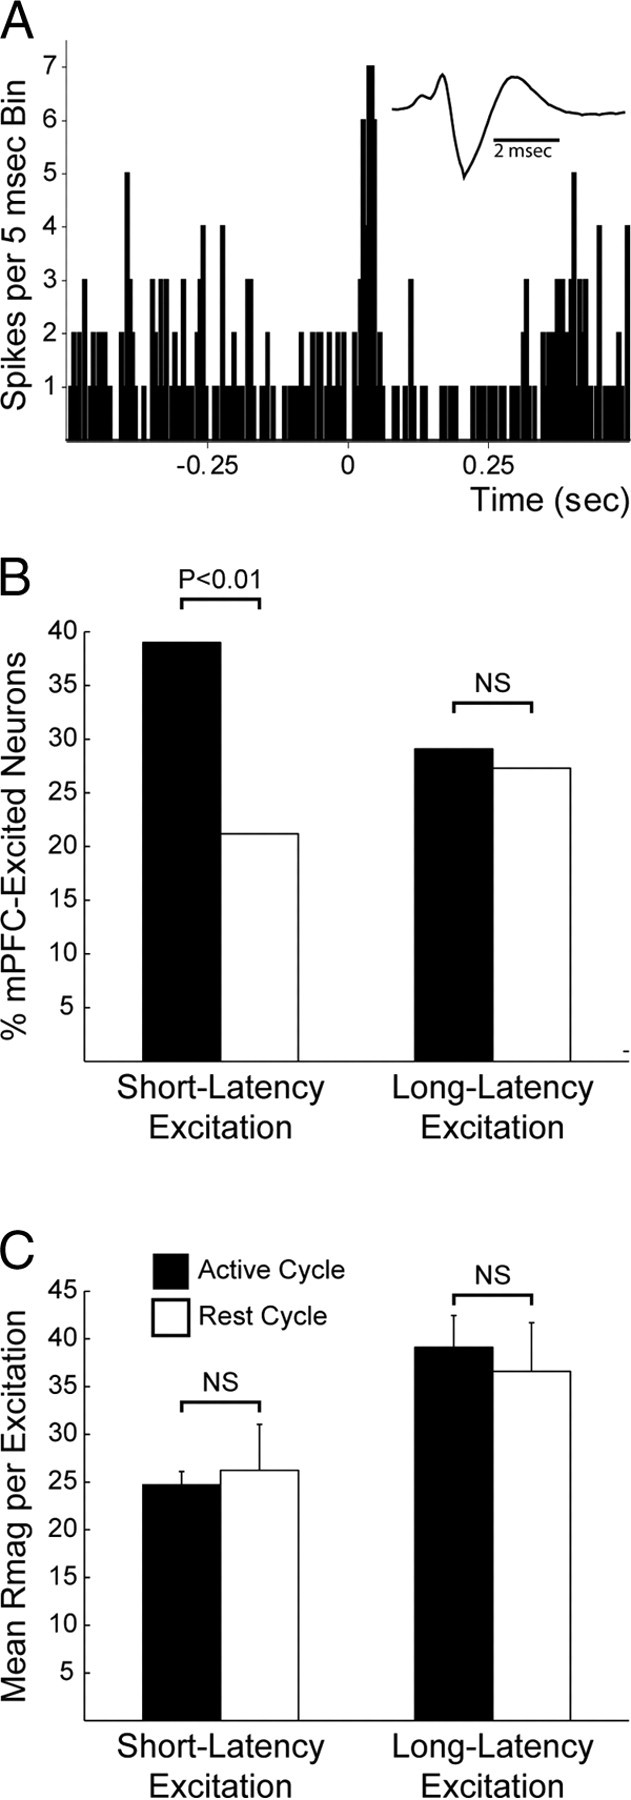
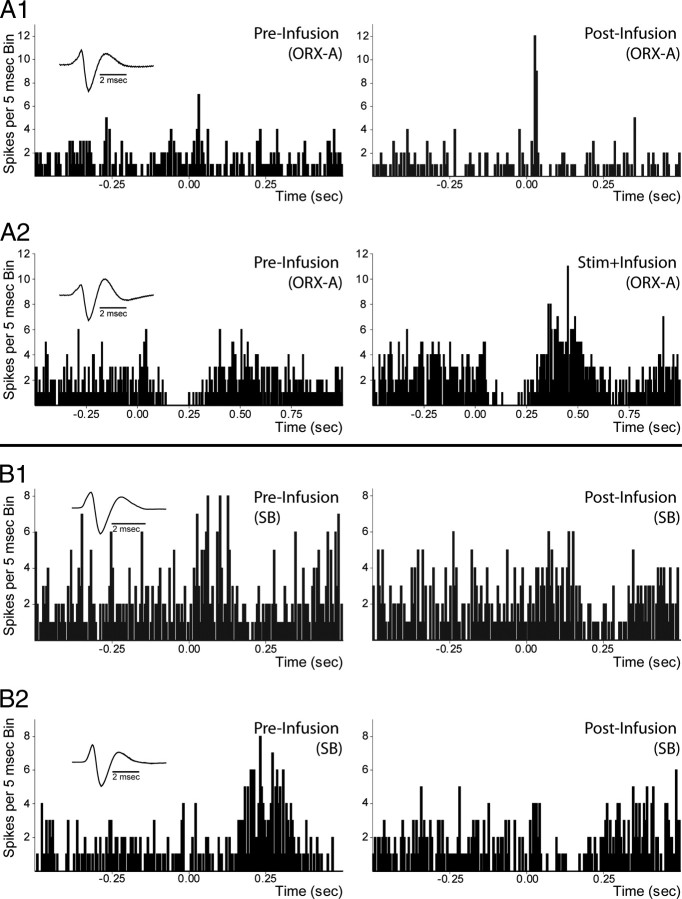
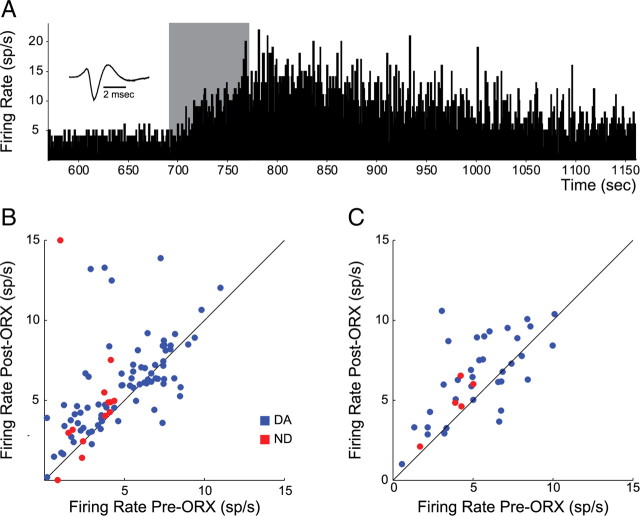
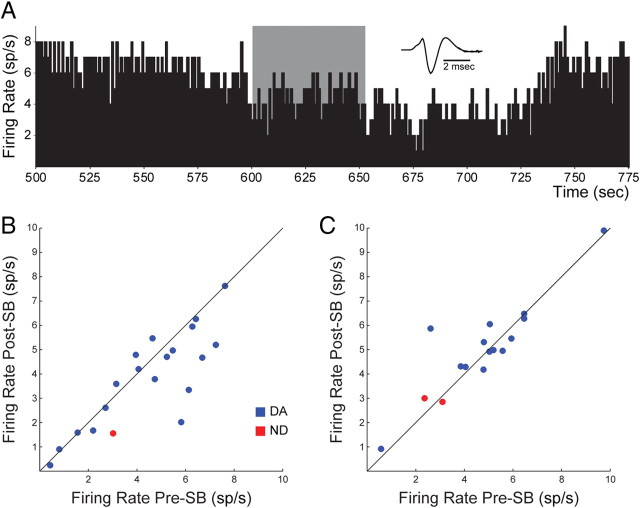
Recent studies show that glutamate and orexin (ORX, also known as hypocretin) inputs to the ventral tegmental area (VTA) dopamine (DA) cell region are essential for conditioned behavioral responses to reward-associated stimuli. In vitro experiments showed that ORX inputs to VTA potentiate responses of DA neurons to glutamate inputs, but it has remained unclear which glutamate inputs are modulated by ORX. The medial prefrontal cortex (mPFC) is a good candidate, given its role in processing complex stimulus-response information and its reciprocal connections with VTA DA neurons. Here we used in vivo recordings in anesthetized rats to investigate the responses of VTA DA neurons to mPFC stimulation, and how these responses are modulated by ORX. We demonstrate that mPFC stimulation evokes short- and long-latency excitation and inhibition in DA neurons. Maximal short-latency excitatory responses originated from stimulation sites in ventral prelimbic/infralimbic cortex, and were significantly more frequent during the active than during the rest period of the diurnal cycle. Application of ORX onto VTA DA neurons increased baseline activity and augmented or revealed excitatory responses to mPFC stimulation independent of changes in baseline activity, and without consistently affecting inhibitory responses. Moreover, orexin-1 receptor antagonism decreased tonic DA cell activity in active- but not rest-period animals, confirming a diurnal influence of ORX. These results indicate that ORX potently influences DA neuron activity, in part by modulating responses to mPFC inputs. By regulating prefrontal control of DA release, ORX projections to VTA may shape motivated behaviors in response to conditioned stimuli.


Figures

Figure 1.
Figure 1.
Dopamine neuron recording and labeling. A–C, Action potential waveforms (A, B) and spontaneous activity (C) of a DA neuron. Dopamine neurons were high-pass filtered at either 100 Hz (A) or 30 Hz (B, C). D, This neuron was juxtacellularly labeled with biotinamide (upper panel, at arrow) and stained with tyrosine hydroxylase (middle panel; lower panel is merged images), demonstrating that it was dopaminergic. Arrows show the juxtacellularly labeled DA neuron. Arrowheads show another DA neuron not labeled with biotinamide.
Figure 2.
Figure 2.
mPFC-evoked excitations in dopamine neurons. A, Example of short-latency excitatory response of a DA neuron evoked by mPFC stimulation (50 pulses, 0.5 Hz). Stimulation occurs at time 0. B, Distributions of latencies (left) and durations (right) of short-latency evoked responses for DA neurons (filled) and non-DA neurons (open) after mPFC stimulation. Abscissa values represent highest value in each bin (e.g., the first bin is 0–5 ms, etc.). Note the apparently bimodal distribution of latencies indicating possible separate monosynaptic and bisynaptic/polysynaptic connections. C, Example of long-latency excitatory responses of a second DA neuron evoked by mPFC stimulation (parameters as in A). D, Distributions of latencies (left) and durations (right) of long-latency evoked responses for DA neurons (filled) and non-DA neurons (open) after mPFC stimulation. Data presented from 143 DA and 22 non-DA neurons from 64 rats. See Materials and Methods for calculation of activation onset latencies and durations. Insets show waveforms of recorded neurons (high-pass filter = 100 Hz).
Figure 3.
Figure 3.
mPFC-evoked inhibitions in dopamine neurons. A, Example of short-latency inhibitory response of a DA neuron evoked by mPFC stimulation (50 pulses, 0.5 Hz). Stimulation occurs at time 0. B, Distributions of latencies (left) and durations (right) of short-latency inhibitory responses for DA neurons (filled) and non-DA neurons (open) after mPFC stimulation. Abscissa values represent highest value in each bin (e.g., the first bin is 0–5 ms, etc.). C, Example of long-latency inhibitory responses of a second DA neuron evoked by mPFC stimulation (parameters as in A). D, Distributions of latencies (left) and durations (right) of long-latency inhibitory responses for DA neurons (filled) and non-DA neurons (open) after mPFC stimulation. Data presented from 175 DA and 32 non-DA neurons from 62 rats. See Materials and Methods for calculation of activation onset latencies and durations. Insets show waveforms of recorded neurons (high-pass filter = 100 Hz).
Figure 4.
Figure 4.
mPFC stimulation sites. A, Example of a marking lesion (at arrow) from a bipolar stimulating electrode in the ventral prelimbic cortex. B, Hemisection plots of prefrontal cortex showing the distribution of stimulation sites characterized by the type of excitatory response evoked in either DA or non-DA neurons. SLE, Short-latency excitatory response; LLE, Long-latency excitatory response; DA, dopamine neuron; ND, nondopamine neuron. SLE markers include neurons exhibiting short- or short- and long-latency responses. LLE markers include neurons only exhibiting long-latency responses. Data are presented from 82 stimulated rats. The plots are arranged rostral (left) to caudal. Frontal sections are shown; medial is to the left. Scale bar in A, 1 mm. The plots in B are modified with permission from Paxinos and Watson (1998).
Figure 5.
Figure 5.
Decreased short-latency excitation at dorsal mPFC stimulation sites. A, Example of a DA neuron exhibiting no short-latency evoked excitation following mPFC stimulation (50 pulses, 0.5 Hz) in the ACC (2.5 mm from brain surface; top histogram). Placing the stimulating electrode at more ventral locations (DV 3.5 middle, DV 4.5 bottom) revealed stronger short-latency evoked responses. Stimulation sites are plotted in B. Cgl, Cingulate cortex; PrL, prelimbic cortex. C, Across all 13 neurons tested in 10 rats, ventral stimulation sites produced significantly greater short-latency evoked responses than dorsal sites. Rmag calculation is described in Materials and Methods. The plots in B are modified from Paxinos and Watson (1998).
Figure 6.
Figure 6.
VTA recording sites. A, Example pontamine sky blue spot (black arrow) marking a recording location in VTA. Note the electrode track just dorsal to the blue spot (white arrow). B, Plots of 67 histologically localized DA neurons exhibiting short- (SLE) or long- (LLE) latency mPFC-evoked excitation recorded in 34 rats. Frontal sections are shown; medial is to the left. Scale bar in A, 0.5 mm. The plots in B are modified from Paxinos and Watson (1998).
Figure 7.
Figure 7.
Application of glutamate antagonists abolishes short-latency evoked responses from mPFC. A, Example of a short-latency mPFC-evoked response of a DA neuron in VTA before application of the glutamate antagonists AP5/CNQX. B, Evoked response is absent 2 min after AP5/CNQX application. C, Partial recovery of evoked response 10 min after application. Rmag calculations were as described in Materials and Methods.
Figure 8.
Figure 8.
Short-latency evoked responses were less frequent in the rest than in the active period. A, Example of a DA neuron recorded during the rest period exhibiting an mPFC-evoked short-latency excitation. B, Significantly fewer neurons recorded during the rest period exhibited short-latency mPFC-evoked responses when compared to neurons recorded during the active period. Fewer long-latency evoked responses were also observed, but the difference was not significant. This effect was mainly driven by differences in DA neurons (see Results). C, Average strength of either short- (left) or long- (right) latency responses. There was no significant difference between the magnitudes of short- and long-latency evoked responses in DA neurons recorded during the active and rest periods (measured as Rmag, see Materials and Methods). Numbers of neurons included in these analyses are shown in Tables 1 and 3.
Figure 9.
Figure 9.
Orexin enhances, and SB 334867 diminishes, mPFC-evoked responses. A, B, Responses of DA neurons, recorded during the active period, to mPFC stimulation preinfusion, stim+infusion, and post-infusion of orexin-A (ORX-A; A panels) or SB 334867 (SB; B panels). A1, Example of short-latency mPFC-evoked responses in a DA neuron before infusion (left) and after infusion (right) of ORX-A. Short-latency evoked responses were enhanced or, in this case, revealed both during and following ORX-A administration (60 nl, 1.4 μm). A2, Example of long-latency evoked responses before infusion (left) and during infusion (stim+infusion; right) of ORX-A in a DA neuron. Long-latency evoked responses were also enhanced by ORX-A administration. B1, Example of short-latency mPFC-evoked responses in a DA neuron before infusion (left) and after infusion (right) of SB. Short-latency evoked responses were diminished during and after SB administration (60 nl, 100 μm). B2, Example of long-latency evoked responses in a DA neuron before infusion (left) and after infusion (right) of SB. Long-latency evoked responses were also diminished by SB administration. For all evoked responses, 50 pulses at 0.5 Hz were delivered. Application of ACSF (60 nl) had no effect on evoked responses. See Results for complete characterizations of evoked responses across the population.
Figure 10.
Figure 10.
Application of orexin-A increased tonic firing of dopamine and nondopamine neurons. A, Example of increased tonic activity in a DA neuron during and following application of 60 nl orexin-A (ORX-A; 1.4 μm; active period recording). The gray bar shows ∼1 min of ORX-A application. B, Scatter plot depicting the change in activity of DA (blue) and non-DA (red) neurons following (y-axis) as compared to before ORX-A application (x-axis) recorded during the active period in 36 rats. Each neuron is represented by one point. Points above the unity line show increased firing rate with ORX-A application. C, Effects of ORX-A application on firing rates of neurons recorded during the rest period in 11 rats. Conventions are as in A.
Figure 11.
Figure 11.
Local ORX1R antagonist application decreased tonic firing of dopamine and nondopamine neurons in the active period only. A, Example of decreased tonic activity in a DA neuron during and following application of 60 nl of SB 334867 (SB; 100 μm). B, C, Neurons recorded during the active period of 12 rats showed significant decreases in spontaneous activity with SB application (B), whereas neurons recorded during the rest periods of 6 rats showed no effect of SB application (C). Conventions are as in Figure 10.

Similar articles

Cited by

References

    1. Akaoka H, Aston-Jones G. Opiate withdrawal-induced hyperactivity of locus coeruleus neurons is substantially mediated by augmented excitatory amino acid input. J Neurosci. 1991;11:3830–3839. - PMC - PubMed
    1. Almodóvar-Fabregas LJ, Segarra O, Colón N, Dones JG, Mercado M, Mejías-Aponte CA, Vázquez R, Abreu R, Vázquez E, Williams JT, Jiménez-Rivera CA. Effects of cocaine administration on VTA cell activity in response to prefrontal cortex stimulation. Ann N Y Acad Sci. 2002;965:157–171. - PubMed
    1. Aston-Jones G, Smith RJ, Moorman DE, Richardson KA. Role of lateral hypothalamic orexin neurons in reward processing and addiction. Neuropharmacology. 2009;56(Suppl 1):112–121. - PMC - PubMed
    1. Aston-Jones G, Smith RJ, Sartor GC, Moorman DE, Massi L, Tahsili-Fahadan P, Richardson KA. Lateral hypothalamic orexin/hypocretin neurons: a role in reward-seeking and addiction. Brain Res. 2010;1314:74–90. - PMC - PubMed
    1. Balcita-Pedicino JJ, Sesack SR. Orexin axons in the rat ventral tegmental area synapse infrequently onto dopamine and gamma-aminobutyric acid neurons. J Comp Neurol. 2007;503:668–684. - PubMed

Publication types

LinkOut - more resources