Comparative Study
. 2010 Nov 17;30(46):15608-15.
doi: 10.1523/JNEUROSCI.2581-10.2010.

ProNGF induces PTEN via p75NTR to suppress Trk-mediated survival signaling in brain neurons

Affiliations
Comparative Study

ProNGF induces PTEN via p75NTR to suppress Trk-mediated survival signaling in brain neurons

Wenyu Song et al. J Neurosci. .

Abstract

Proneurotrophins and mature neurotrophins activate different signaling pathways with distinct effects on their target cells: proneurotrophins can induce apoptotic signaling via p75(NTR), whereas mature neurotrophins activate Trk receptors to influence survival and differentiation. Here, we demonstrate that the PTEN (phosphatase and tensin homolog deleted on chromosome 10) phosphatase represents a novel switch between the survival and apoptotic signaling pathways in rat CNS neurons. Simultaneous activation of p75(NTR) by proNGF and TrkB signaling by BDNF elicited apoptosis despite TrkB phosphorylation. Apoptosis induced by p75(NTR) required suppression of TrkB-induced phosphoinositide-3 kinase signaling, mediated by induction of PTEN, for apoptosis to proceed. Inhibition of PTEN restored the ability of BDNF to phosphorylate Akt and protect cultured basal forebrain neurons from proNGF-induced death. In vivo, inhibition or knockdown of PTEN after pilocarpine-induced seizures protected CNS neurons from p75(NTR)-mediated death, demonstrating that PTEN is a crucial factor mediating the balance between p75(NTR)-induced apoptotic signaling and Trk-mediated survival signaling in brain neurons.


Figures

Figure 1.
Figure 1.
ProNGF increases PTEN in BF neurons. A, E16 BF neurons were cultured for 5 d and treated with proNGF (1 ng/ml) at different time points, as indicated. Cells were lysed for Western blot analysis and probed for p-PTEN and PTEN. Blots were stripped and reprobed for actin. The blot shown is representative of five independent experiments. B, Quantification of PTEN relative to p-PTEN. Data are from five independent experiments and shown as mean band density ± SE. The asterisk indicates values different from control by ANOVA with Bonferroni post hoc analysis (p < 0.05). C, Induction of PTEN by proNGF requires both p75 and sortilin receptors. BF neurons were pretreated with anti-sortilin or anti-p75NTR antibodies for 30 min and then treated with proNGF (10 ng/ml, 30 min) alone or with the antibodies. The level of PTEN protein was measured by Western blot analysis. The blots were stripped and reprobed for tubulin. The blots shown are representative of three independent experiments. D, Quantification of three independent experiments exemplified in C and represented as mean band density ± SE. Asterisks indicates values different from control by ANOVA with Bonferroni post hoc analysis (p < 0.05). E, ProNGF does not regulate PTEN mRNA in BF neurons. BF neurons were treated with proNGF for the indicated times. Total RNA was extracted, and qPCR was performed to detect the level of PTEN mRNA relative to GAPDH mRNA. Data are from three independent experiments. F, New protein synthesis, but not mRNA synthesis, is required for PTEN induction. Cultured BF neurons were treated with proNGF (1 ng/ml, 30 min), cycloheximide (CHX; 1 μg/ml, 60 min), actinomycin-D (actinoD; 1.5 μm, 60 min), or both. Western blot analysis was performed to detect the level of PTEN. Blots were then stripped and reprobed for tubulin. The blot is representative of three independent experiments. G, ProNGF increases PTEN in the presence of BDNF. Cultured BF neurons were treated with BDNF (10 ng/ml), proNGF(1 ng/ml), or both for 30 min. Western blot was performed to probe for PTEN and stripped and reprobed for Erk to demonstrate equal protein loading. The blot is representative of three independent experiments. H, Quantification of PTEN relative to Erk from three independent experiments. Bars represent mean band density ± SE. The asterisk indicates values different from control by ANOVA with Bonferroni post hoc analysis, p < 0.05. con, Control.
Figure 2.
Figure 2.
BDNF induces phosphorylation of PTEN via the PI3K pathway, which can be blocked by proNGF. A, BDNF increases phosphorylated PTEN protein in BF neurons. E16 neurons were cultured for 5 d before being treated with BDNF (10 ng/ml) for the indicated time points. Cells were lysed for Western blot to probe for p-PTEN and PTEN. Blots were stripped and reprobed for actin. The blot is representative of three independent experiments. B, ProNGF inhibits BDNF-induced phosphorylation of PTEN. BF neurons were treated with BDNF for 10 and 30 min in the presence or absence of proNGF. The levels of p-PTEN and PTEN were measured by Western blot. The blot was stripped and reprobed for tubulin. The blot is representative of three independent experiments. C, The PI3K pathway inhibitor blocks induction of p-PTEN by BDNF. BF neurons were treated with PI3K pathway inhibitor LY294002 (50 μm), MAPK pathway inhibitor PD98059 (10 μm), or PLCγ inhibitor U73122 (1 μm) before being treated with BDNF for 30 min. Lysates were analyzed by Western blot for p-PTEN and PTEN. The blot was stripped and reprobed for tubulin. The blot is representative of three independent experiments. con, Control.
Figure 3.
Figure 3.
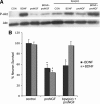
PTEN inhibitor reverses the inhibition by proNGF of BDNF-induced Akt phosphorylation and survival of BF neurons. A, PTEN inhibitor reverses the inhibition of Akt activation by proNGF. E16 BF neurons were cultured in the presence of BDNF for 5 d. The cells were then treated with BDNF (10 ng/ml, re-added to ensure that TrkB receptors were activated), proNGF (1 ng/ml), or BDNF plus proNGF in the presence or absence of the PTEN inhibitor bpv(pic) (5 μm). Western blot analysis was performed to probe for p-Akt. Blots were then stripped and reprobed for total Akt. The blot is representative of four independent experiments. CON, Control. B, PTEN inhibitor rescues BF neurons from proNGF-induced death only in the presence of BDNF. Cultured E16 BF neurons were treated overnight with proNGF (1 ng/ml) alone or proNGF plus bpv(pic) (5 μm) in the presence or absence of BDNF (10 ng/ml). A survival assay was performed to count the number of healthy neurons in the culture and indicated as the percentage of total cells. Data are from three independent experiments and expressed as mean percent survival ± SE. The asterisk indicates values different from control by ANOVA with Bonferroni post hoc analysis at p < 0.05.
Figure 4.
Figure 4.
PTEN siRNA rescues BF neurons from proNGF-induced apoptosis in the presence of BDNF. A, A penetratin-linked PTEN siRNA was used to knock down PTEN protein levels. BF neurons were treated with PTEN siRNA for the indicated times and analyzed by Western blot to detect PTEN protein. The blot was stripped and reprobed for actin. B, PTEN siRNA inhibited the increase of PTEN induced by proNGF. BF neurons were pretreated with control or PTEN siRNA for 30 min before being treated with proNGF (1 ng/ml) for 30 min. Western blot analysis was performed to detect PTEN protein. The blot is representative of three independent experiments. C, D, PTEN siRNA blocks proNGF-induced death only in the presence of BDNF. Cultured BF neurons were treated overnight with vehicle (control), proNGF alone (1 ng/ml), control siRNA or PTEN siRNA alone, or siRNA combined with proNGF in the presence (C) or absence (D) of BDNF (10 ng/ml). The number of healthy neurons was counted and indicated as the percentage of total cells ± SE. Data are from three independent experiments. The asterisk indicates values different from control by ANOVA with Bonferroni post hoc analysis at p < 0.05. con, Control; con si, control siRNA; si PTEN, PTEN siRNA.
Figure 5.
Figure 5.
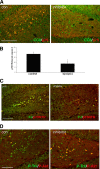
PTEN inhibitor rescues neuronal loss after seizure. Adult rats were cannulated bilaterally in the dorsal hippocampus 1 week before pilocarpine-induced seizure. After seizures, PTEN inhibitor [bpv(pic), 5 μm] was infused into one side and saline was infused into the contralateral side twice per day for 3 d. A, Double immunostaining for p75NTR and cleaved caspase 3 was performed on hippocampal brain sections. There is a decrease in the number of cells expressing both p75NTR and cleaved caspase 3 on the side with the inhibitor relative to the control side in the same brain sections. B, The number of cells expressing both p75NTR and cleaved caspase 3 was counted in both hippocampal hemispheres. The average number of cells coexpressing p75NTR and cleaved caspase 3 from three independent experiments was calculated and shown as mean ± SE. The asterisk indicates the value significantly different from control at p < 0.05 by Student's t test. C, Double staining for Fluoro-Jade B (FJ) and p75NTR demonstrated fewer dying neurons on the side receiving inhibitor relative to the control side. D, Double immunostaining for phospho-Trk and phospho-Akt on hippocampal sections. More cells expressing p-Akt were observed on the side with the PTEN inhibitor relative to the side receiving saline in the same brain. Scale bars, 50 μm. con, Control.
Figure 6.
Figure 6.
PTEN siRNA rescues neuronal loss after seizure. Adult rats were cannulated bilaterally in the dorsal hippocampus 1 week before pilocarpine-induced seizure. After seizures, penetratin-linked PTEN siRNA was infused into one side and a control penetratin-linked siRNA was infused into the contralateral side twice per day for 3 d. A, Double immunostaining for p75NTR and cleaved caspase 3 was performed on hippocampal brain sections. Scale bar, 50 μm. B, The average number of cells coexpressing p75NTR and cleaved caspase 3 from three independent experiments was calculated and is shown as mean ± SE. The asterisk indicates the value significantly different from control at p < 0.05 by Student's t test.
Figure 7.
Figure 7.
Schematic diagram of the interaction of p75NTR and TrkB signaling. Apoptosis induced by proNGF via p75NTR requires suppression of the TrkB-induced PI3K pathway by PTEN. When PTEN is inhibited, BDNF-induced activation of Akt can inhibit apoptosis.

Similar articles

Cited by

References

    1. Alderson RF, Alterman AL, Barde Y-A, Lindsay RM. Brain-derived neurotrophic factor increases survival and differentiated functions of rat septal cholinergic neurons in culture. Neuron. 1990;5:297–306. - PubMed
    1. Arevalo JC, Wu SH. Neurotrophin signaling: many exciting surprises! Cell Mol Life Sci. 2006;63:1523–1537. - PMC - PubMed
    1. Backman SA, Stambolic V, Suzuki A, Haight J, Elia A, Pretorius J, Tsao MS, Shannon P, Bolon B, Ivy GO, Mak TW. Deletion of Pten in mouse brain causes seizures, ataxia and defects in soma size resembling Lhermitte-Duclos disease. Nat Genet. 2001;29:396–403. - PubMed
    1. Beattie MS, Harrington AW, Lee R, Kim JY, Boyce SL, Longo FM, Bresnahan JC, Hempstead BL, Yoon SO. ProNGF induces p75-mediated death of oligodendrocytes following spinal cord injury. Neuron. 2002;36:375–386. - PMC - PubMed
    1. Bibel M, Barde YA. Neurotrophins: key regulators of cell fate and cell shape in the vertebrate nervous system. Genes Dev. 2000;14:2919–2937. - PubMed

Publication types

MeSH terms