. 2011 Jan;21(1):106-13.
doi: 10.1101/gr.112748.110. Epub 2010 Nov 17.

Copy number variation modifies expression time courses

Affiliations

Copy number variation modifies expression time courses

Evelyne Chaignat et al. Genome Res. 2011 Jan.

Abstract

A preliminary understanding into the phenotypic effect of DNA segment copy number variation (CNV) is emerging. These rearrangements were demonstrated to influence, in a somewhat dose-dependent manner, the expression of genes that map within them. They were also shown to modify the expression of genes located on their flanks and sometimes those at a great distance from their boundary. Here we demonstrate, by monitoring these effects at multiple life stages, that these controls over expression are effective throughout mouse development. Similarly, we observe that the more specific spatial expression patterns of CNV genes are maintained through life. However, we find that some brain-expressed genes mapping within CNVs appear to be under compensatory loops only at specific time points, indicating that the effect of CNVs on these genes is modulated during development. Notably, we also observe that CNV genes are significantly enriched within transcripts that show variable time courses of expression between strains. Thus, modifying the copy number of a gene may potentially alter not only its expression level, but also the timing of its expression.


Figures

Figure 1.
Figure 1.
Spatial expression patterns of CNV genes distribution of CNV (black) and non-CNV (white) expressed transcripts in function of the number of anatomical structures in which they are detected at embryonic stage E14.5 by in situ hybridization performed by the EURexpress consortium (http://www.eurexpress.org/ee/). CNV genes are expressed in a significantly smaller number of anatomical structures (two-tailed Mann-Whitney U-test, P = 0.04).
Figure 2.
Figure 2.
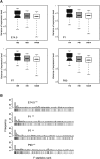
(A) Expression throughout development of genes within CNVs, in neighboring regions, and elsewhere in the genome. Boxplot distribution of signal variances (nine individuals, three strains) of transcripts expressed in the liver at E14.5, P1, P7, and P90, and mapping within CNVs (black), 50–250 kb from the nearest CNV breakpoint (gray), or further away (white). The black (largest two-tailed Mann-Whitney U test, P = 1.3 × 10⁻⁷) and the gray distributions (largest two-tailed Mann-Whitney U test, P = 0.02) are significantly different from the white in all monitored tissues. The numbers of transcripts for which expression could be detected are indicated. Similar results were obtained for brain transcripts (Supplemental Table S1). (B) Overrepresentation of CNV genes among differentially expressed genes. For each gene, we calculated the F statistics representing the differential expression of transcripts in each tissue and developmental time point using the Bioconductor limma package. We then ranked genes by their F-statistic and binned the ranked genes into 50 bins. For each tissue and time point, we display the number of CNV genes in each bin, ordering bins from the highest F-statistic on the left to the lowest F-statistic on the right; the number of CNV genes is given by the height of the bar and CNV genes in each are indicated by tick marks below the histogram. Data from the liver at each time point are shown here as examples; similar results were obtained for brain transcripts (see text for details). Under the assumption that genes are equally likely to be CNV genes independent of their expression differences, the number of CNV genes should be uniformly distributed among bins, as indicated by the dashed line. We tested this assumption using a two-tailed Mann-Whitney U test. The assumption of uniform distribution was rejected for both brain and liver at all developmental stages assessed (**P < 0.001), indicating an overrepresentation of CNV genes among differentially expressed genes throughout development.
Figure 3.
Figure 3.
Examples of time course expression profiles in liver. Relative expression levels of CNV transcripts during development in the three inbred strains: C57BL/6J (black line), DBA/2J (red), and 129S2 (teal). Examples of CNV transcripts under regulatory feedback loops that buffer gene-dosage alterations (transcript monitored by probeset 1426197_at; A), showing a positive correlation between relative copy number and expression levels (1424877_a_at, 1418684_at, and 1428738_a_at; BD, respectively), showing a positive correlation between relative copy number and expression level in one strain and buffering of gene dosage in another (1434962_x_at; E), or with modified time courses of expression (1427758_x_at, 1431294_at, 1425436_x_at, and 1424936_a_at; FI, respectively). Bar graphs on the right show the log2 ratios for the CNV encompassing the transcript considered in C57BL/6J (black), DBA/2J (red), and 129S2 strains (teal) relative to the C57BL/6J reference as determined by array CGH in Henrichsen et al. (2009b). We note that the noise-robust soft clustering algorithm Mfuzz (Futschik and Carlisle 2005) included in the same cluster the time courses registered for the CNV transcript 1426197_at in A) in the three different mouse inbred strains, while all other CNV transcripts shown here were incorporated in multiple clusters, thus illustrating the propensity of CNV genes to change their timing of expression between strains (see text for details).
Figure 4.
Figure 4.
Ten-stage expression profiles of liver CNV transcripts. Real-time quantitative PCR-measured relative expression levels of CNV transcripts during development (E12.5, E14.5, E 16.5, E17.5, E18.5, P1, P7, P14, P30, P90 time points) in the three inbred strains: C57BL/6J (black line), DBA/2J (red), and 129S2 (teal). Examples of liver CNV transcripts showing a similar (A) or a divergent expression profile between strains are shown (B–D). (REL) Relative expression level. (E) Assessed transcripts were ranked decreasingly by the sum of squared deviations from the mean between strains for each developmental time point. (Filled circles) CNV transcripts; (open circles) non-CNV transcripts. Data from liver are shown, while data from brain are presented in Supplemental Figure S4. We observe in both brain and liver a statistically significant enrichment of CNV transcripts among the transcripts with the highest score, i.e., the transcripts that vary more between strains (see text for details; Wilcoxon signed-rank test P = 6 × 10⁻⁶ [liver] and P = 10−3 [brain]). The position within the ranking of the CNV-transcript profiles presented as examples in AD are indicated.

References

    1. Al-Shahrour F, Minguez P, Tarraga J, Montaner D, Alloza E, Vaquerizas JM, Conde L, Blaschke C, Vera J, Dopazo J 2006. BABELOMICS: A systems biology perspective in the functional annotation of genome-scale experiments. Nucleic Acids Res 34: W472–W476 - PMC - PubMed
    1. Al-Shahrour F, Carbonell J, Minguez P, Goetz S, Conesa A, Tarraga J, Medina I, Alloza E, Montaner D, Dopazo J 2008. Babelomics: Advanced functional profiling of transcriptomics, proteomics and genomics experiments. Nucleic Acids Res 36: W341–W346 - PMC - PubMed
    1. Cahan P, Li Y, Izumi M, Graubert TA 2009. The impact of copy number variation on local gene expression in mouse hematopoietic stem and progenitor cells. Nat Genet 41: 430–437 - PMC - PubMed
    1. Carvalho CM, Zhang F, Lupski JR 2010. Genomic disorders: A window into human gene and genome evolution. Proc Natl Acad Sci 107 Suppl 1: 1765–1771 - PMC - PubMed
    1. Conrad DF, Pinto D, Redon R, Feuk L, Gokcumen O, Zhang Y, Aerts J, Andrews TD, Barnes C, Campbell P, et al. 2010. Origins and functional impact of copy number variation in the human genome. Nature 464: 704–712 - PMC - PubMed

Publication types

Associated data