

Enhanced angiotensin II-mediated central sympathoexcitation in streptozotocin-induced diabetes: role of superoxide anion
- PMID: 21084672
- PMCID: PMC3051357
- DOI: 10.1152/ajpregu.00246.2010
Enhanced angiotensin II-mediated central sympathoexcitation in streptozotocin-induced diabetes: role of superoxide anion
Abstract
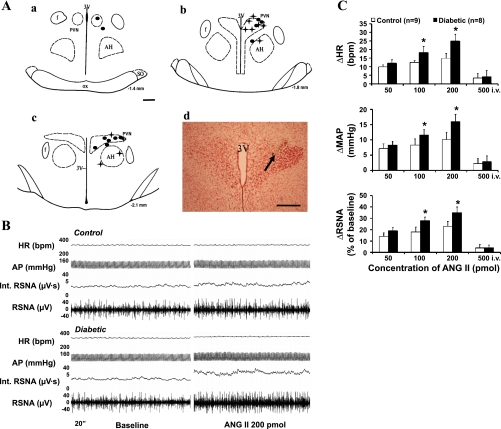
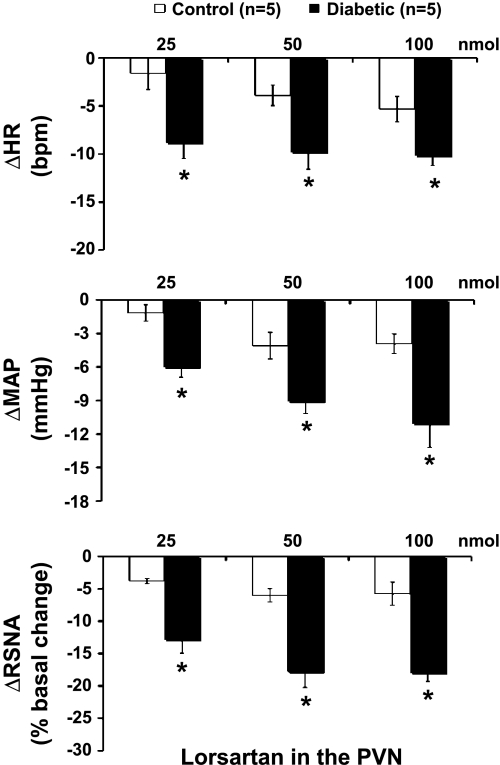
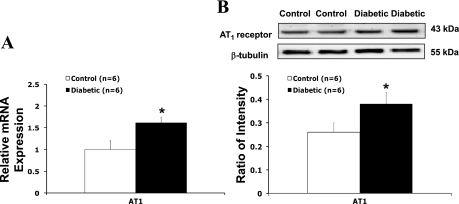
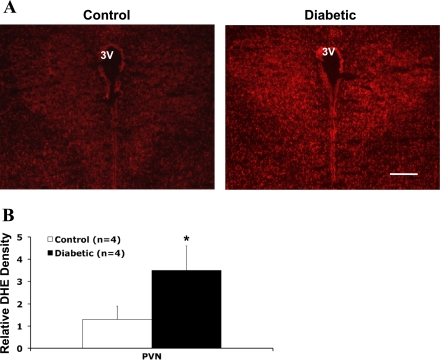
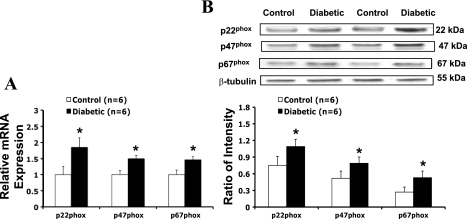
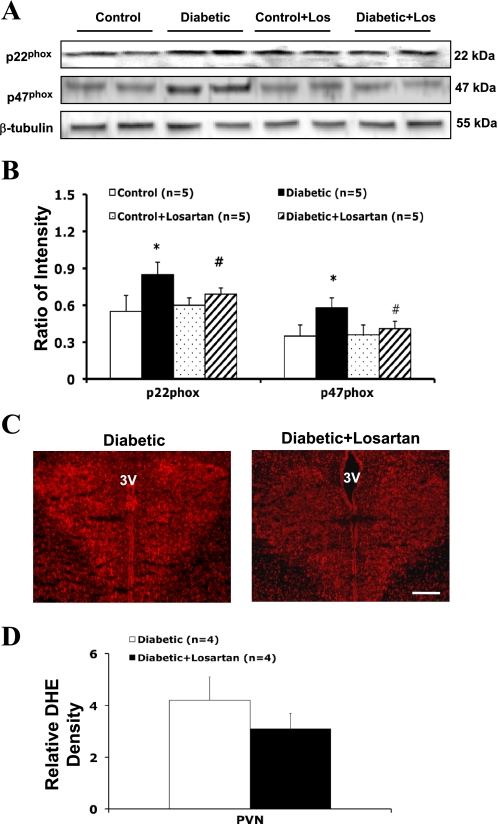
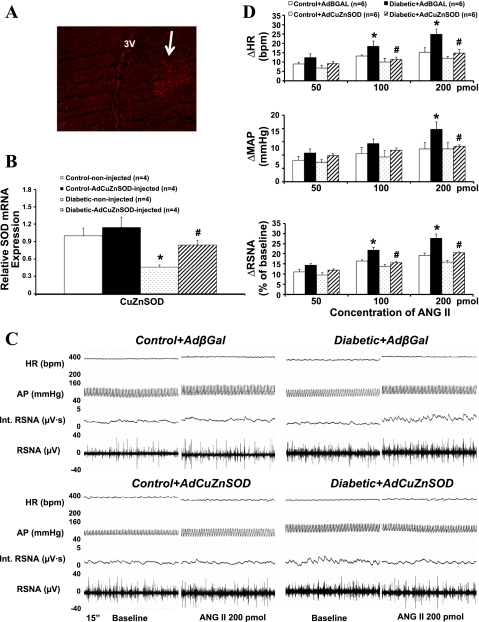
Studies have shown that the superoxide mechanism is involved in angiotensin II (ANG II) signaling in the central nervous system. We hypothesized that ANG II activates sympathetic outflow by stimulation of superoxide anion in the paraventricular nucleus (PVN) of streptozotocin (STZ)-induced diabetic rats. In α-chloralose- and urethane-anesthetized rats, microinjection of ANG II into the PVN (50, 100, and 200 pmol) produced dose-dependent increases in renal sympathetic nerve activity (RSNA), arterial pressure (AP), and heart rate (HR) in control and STZ-induced diabetic rats. There was a potentiation of the increase in RSNA (35.0 ± 5.0 vs. 23.0 ± 4.3%, P < 0.05), AP, and HR due to ANG II type I (AT(1)) receptor activation in diabetic rats compared with control rats. Blocking endogenous AT(1) receptors within the PVN with AT(1) receptor antagonist losartan produced significantly greater decreases in RSNA, AP, and HR in diabetic rats compared with control rats. Concomitantly, there were significant increases in mRNA and protein expression of AT(1) receptor with increased superoxide levels and expression of NAD(P)H oxidase subunits p22(phox), p47(phox), and p67(phox) in the PVN of rats with diabetes. Pretreatment with losartan (10 mg·kg(-1)·day(-1) in drinking water for 3 wk) significantly reduced protein expression of NAD(P)H oxidase subunits (p22(phox) and p47(phox)) in the PVN of diabetic rats. Pretreatment with adenoviral vector-mediated overexpression of human cytoplasmic superoxide dismutase (AdCuZnSOD) within the PVN attenuated the increased central responses to ANG II in diabetes (RSNA: 20.4 ± 0.7 vs. 27.7 ± 2.1%, n = 6, P < 0.05). These data support the concept that superoxide anion contributes to an enhanced ANG II-mediated signaling in the PVN involved with the exaggerated sympathoexcitation in diabetes.
Figures
Similar articles
-
Angiotensin II and angiotensin-(1-7) in paraventricular nucleus modulate cardiac sympathetic afferent reflex in renovascular hypertensive rats.PLoS One. 2012;7(12):e52557. doi: 10.1371/journal.pone.0052557. Epub 2012 Dec 20. PLoS One. 2012. PMID: 23285085 Free PMC article.
-
Enhanced angiotensin-mediated excitation of renal sympathetic nerve activity within the paraventricular nucleus of anesthetized rats with heart failure.Am J Physiol Regul Integr Comp Physiol. 2009 Nov;297(5):R1364-74. doi: 10.1152/ajpregu.00149.2009. Epub 2009 Aug 26. Am J Physiol Regul Integr Comp Physiol. 2009. PMID: 19710393 Free PMC article.
-
Superoxide anions modulate the performance of apelin in the paraventricular nucleus on sympathetic activity and blood pressure in spontaneously hypertensive rats.Peptides. 2019 Nov;121:170051. doi: 10.1016/j.peptides.2018.12.005. Epub 2018 Dec 21. Peptides. 2019. PMID: 30582943
-
Intermedin in Paraventricular Nucleus Attenuates Ang II-Induced Sympathoexcitation through the Inhibition of NADPH Oxidase-Dependent ROS Generation in Obese Rats with Hypertension.Int J Mol Sci. 2019 Aug 28;20(17):4217. doi: 10.3390/ijms20174217. Int J Mol Sci. 2019. PMID: 31466304 Free PMC article.
-
Mechanisms of renal sympathetic activation in renovascular hypertension.Exp Physiol. 2015 Apr 20;100(5):496-501. doi: 10.1113/expphysiol.2014.079855. Exp Physiol. 2015. PMID: 25639235 Review.
Cited by
-
Reactive Oxygen Species in the Paraventricular Nucleus of the Hypothalamus Alter Sympathetic Activity During Metabolic Syndrome.Front Physiol. 2015 Dec 23;6:384. doi: 10.3389/fphys.2015.00384. eCollection 2015. Front Physiol. 2015. PMID: 26779026 Free PMC article. Review.
-
Sympathetic Overactivity in Chronic Kidney Disease: Consequences and Mechanisms.Int J Mol Sci. 2017 Aug 2;18(8):1682. doi: 10.3390/ijms18081682. Int J Mol Sci. 2017. PMID: 28767097 Free PMC article. Review.
-
The central renin-angiotensin system and sympathetic nerve activity in chronic heart failure.Clin Sci (Lond). 2014 May;126(10):695-706. doi: 10.1042/CS20130294. Clin Sci (Lond). 2014. PMID: 24490814 Free PMC article. Review.
-
A novel role for miR-133a in centrally mediated activation of the renin-angiotensin system in congestive heart failure.Am J Physiol Heart Circ Physiol. 2017 May 1;312(5):H968-H979. doi: 10.1152/ajpheart.00721.2016. Epub 2017 Mar 10. Am J Physiol Heart Circ Physiol. 2017. PMID: 28283551 Free PMC article.
-
Elevated angiotensin II in rat nodose ganglia primes diabetes-blunted arterial baroreflex sensitivity: involvement of NADPH oxidase-derived superoxide.J Diabetes Metab. 2011 Sep 8;2(6):1000135. doi: 10.4172/2155-6156.1000135. J Diabetes Metab. 2011. PMID: 22308229 Free PMC article.
References
-
- Bakris G. Are there effects of renin-angiotensin system antagonists beyond blood pressure control? Am J Cardiol 105: 21A–29A, 2010 - PubMed
-
- Brooks VL. Interactions between angiotensin II and the sympathetic nervous system in the long-term control of arterial pressure. Clin Exp Pharmacol Physiol 24: 83–90, 1997 - PubMed
-
- Chang KS, Lund DD. Alterations in the baroreceptor reflex control of heart rate in streptozotocin diabetic rats. J Mol Cell Cardiol 18: 617–624, 1986 - PubMed
-
- Chappey O, Dosquet C, Wautier MP, Wautier JL. Advanced glycation end products, oxidant stress and vascular lesions. Eur J Clin Invest 27: 97–108, 1997 - PubMed
Publication types
MeSH terms
Substances
Grants and funding
LinkOut - more resources
Full Text Sources
Research Materials
Miscellaneous