

Analytical construct of reversible desensitization of pituitary-testicular signaling: illustrative application in aging
- PMID: 21084679
- PMCID: PMC3043799
- DOI: 10.1152/ajpregu.00477.2010
Analytical construct of reversible desensitization of pituitary-testicular signaling: illustrative application in aging
Abstract
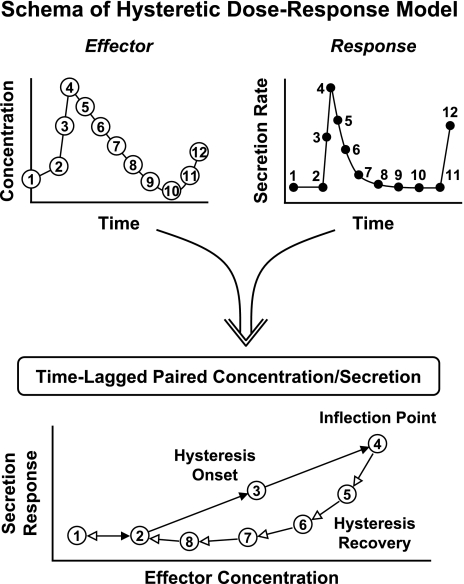
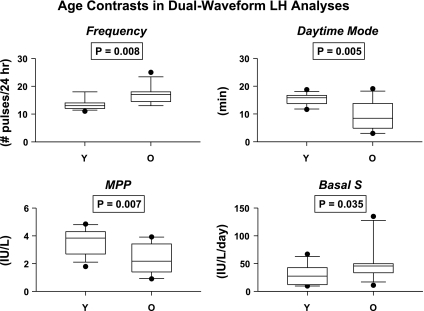
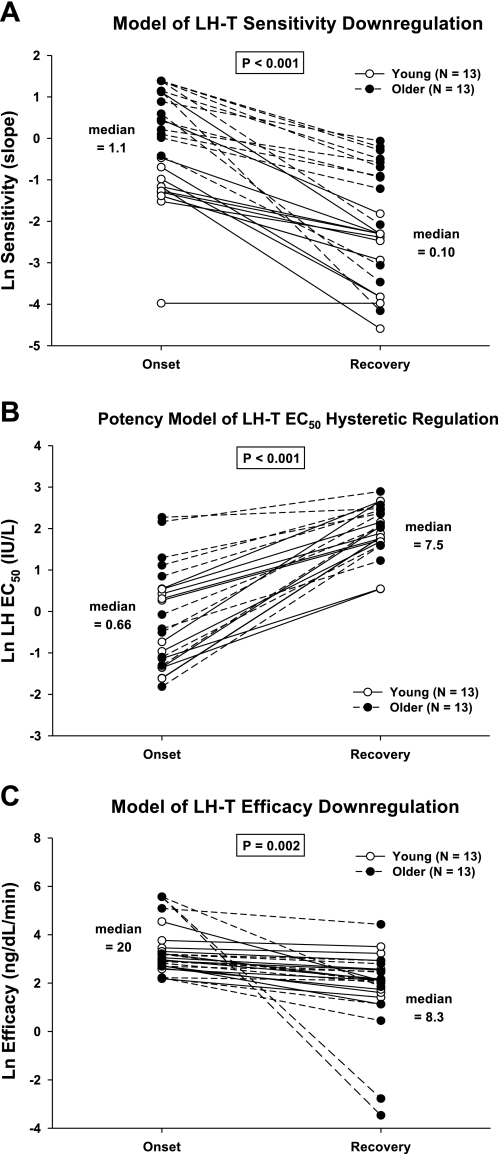
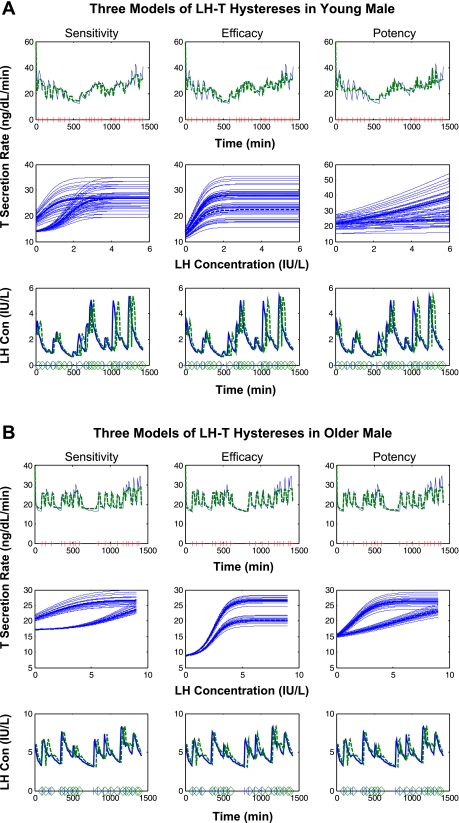
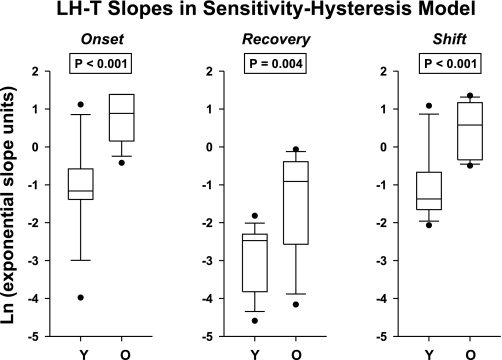
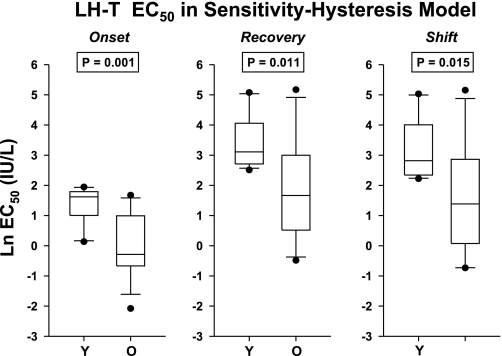
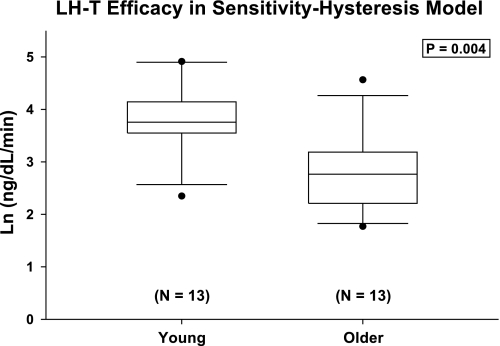
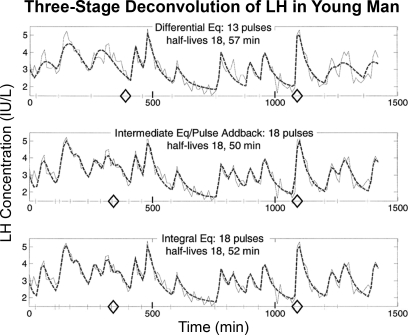
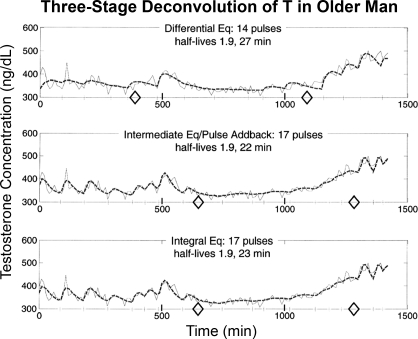
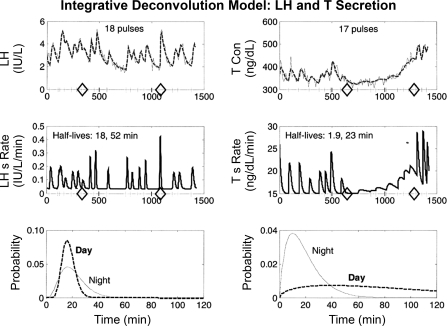
Luteinizing hormone (LH) administered in pharmacological amounts downregulates Leydig cell steroidogenesis. Whether reversible downregulation of physiological gonadotropin drive operates in vivo is unknown. Most of the analytical models of dose-response functions that have been constructed are biased by the assumption that no downregulation exists. The present study employs a new analytical platform to quantify potential (but not required) pulsatile cycles of LH-testosterone (T) dose-response stimulation, desensitization, and recovery (pulse-by-pulse hysteresis) in 26 healthy men sampled every 10 min for 24 h. A sensitivity-downregulation hysteresis construct predicted marked hysteresis with a median time delay to LH dose-response inflection within individual T pulses of 23 min and with median T pulse onset and recovery LH sensitivities of 1.1 and 0.10 slope unit, respectively (P < 0.001). A potency-downregulation model yielded median estimates of one-half maximally stimulatory LH concentrations (EC(50) values) of 0.66 and 7.5 IU/l for onset and recovery, respectively (P < 0.001). An efficacy-downregulation formulation of hysteresis forecasts median LH efficacies of 20 and 8.3 ng·dl(-1)·min(-1) for onset and offset of T secretory burst, respectively (P = 0.002). Segmentation of the LH-T data by age suggested greater sensitivity, higher EC(50) (increased LH potency), and markedly (2.7-fold) attenuated LH efficacy in older individuals. Each of the three hysteresis models yielded a marked (P < 0.005) reduction in estimated model residual error compared with no hysteresis. In summary, model-based analyses allowing for (but not requiring) reversible pituitary-gonadal effector-response downregulation are consistent with a hypothesis of recurrent, brief cycles of LH-dependent stimulation, desensitization, and recovery of pulsatile T secretion in vivo and an age-associated reduction of LH efficacy. Prospective studies would be required to prove this aging effect.
Figures
Similar articles
-
Dynamic testosterone responses to near-physiological LH pulses are determined by the time pattern of prior intravenous LH infusion.Am J Physiol Endocrinol Metab. 2012 Sep 15;303(6):E720-8. doi: 10.1152/ajpendo.00200.2012. Epub 2012 Jul 17. Am J Physiol Endocrinol Metab. 2012. PMID: 22811471 Free PMC article. Clinical Trial.
-
Older men exhibit reduced efficacy of and heightened potency downregulation by intravenous pulses of recombinant human LH: a study in 92 healthy men.Am J Physiol Endocrinol Metab. 2012 Jan 1;302(1):E117-22. doi: 10.1152/ajpendo.00450.2011. Epub 2011 Oct 4. Am J Physiol Endocrinol Metab. 2012. PMID: 21971523 Free PMC article.
-
Age diminishes the testicular steroidogenic response to repeated intravenous pulses of recombinant human LH during acute GnRH-receptor blockade in healthy men.Am J Physiol Endocrinol Metab. 2005 Apr;288(4):E775-81. doi: 10.1152/ajpendo.00410.2004. Epub 2004 Nov 30. Am J Physiol Endocrinol Metab. 2005. PMID: 15572655
-
Operating characteristics of the male hypothalamo-pituitary-gonadal axis: pulsatile release of testosterone and follicle-stimulating hormone and their temporal coupling with luteinizing hormone.J Clin Endocrinol Metab. 1987 Nov;65(5):929-41. doi: 10.1210/jcem-65-5-929. J Clin Endocrinol Metab. 1987. PMID: 3117834
-
Steroidal regulation of biologically active luteinizing hormone secretion in men and women.Hum Reprod. 1993 Nov;8 Suppl 2:84-96. doi: 10.1093/humrep/8.suppl_2.84. Hum Reprod. 1993. PMID: 8276976 Review.
Cited by
-
Reduced nocturnal ACTH-driven cortisol secretion during critical illness.Am J Physiol Endocrinol Metab. 2014 Apr 15;306(8):E883-92. doi: 10.1152/ajpendo.00009.2014. Epub 2014 Feb 25. Am J Physiol Endocrinol Metab. 2014. PMID: 24569590 Free PMC article.
-
Dynamic testosterone responses to near-physiological LH pulses are determined by the time pattern of prior intravenous LH infusion.Am J Physiol Endocrinol Metab. 2012 Sep 15;303(6):E720-8. doi: 10.1152/ajpendo.00200.2012. Epub 2012 Jul 17. Am J Physiol Endocrinol Metab. 2012. PMID: 22811471 Free PMC article. Clinical Trial.
-
Endogenous ACTH concentration-cortisol secretion dose analysis unmasks decreased ACTH potency in Cushing's disease with restoration after successful pituitary adenomectomy.J Clin Endocrinol Metab. 2011 Dec;96(12):3768-74. doi: 10.1210/jc.2011-1878. Epub 2011 Sep 14. J Clin Endocrinol Metab. 2011. PMID: 21917875 Free PMC article.
-
Somatostatin is essential for the sexual dimorphism of GH secretion, corticosteroid-binding globulin production, and corticosterone levels in mice.Endocrinology. 2015 Mar;156(3):1052-65. doi: 10.1210/en.2014-1429. Epub 2014 Dec 31. Endocrinology. 2015. PMID: 25551181 Free PMC article.
-
Glucose ingestion acutely lowers pulsatile LH and basal testosterone secretion in men.Am J Physiol Endocrinol Metab. 2012 Mar 15;302(6):E724-30. doi: 10.1152/ajpendo.00520.2011. Epub 2012 Jan 17. Am J Physiol Endocrinol Metab. 2012. PMID: 22252939 Free PMC article.
References
-
- Anonymous Academic Press Dictionary of Science and Technology. New York: Harcourt, Brace, Janovich, 1992
-
- Baird CJ, Tharandt L, Tamarkin L. Regulation of luteinizing hormone release by pulsatile and continuous administration of gonadotropin-releasing hormone to superfused rat and hamster pituitary cells. Endocrinology 114:1041–1047, 1984 - PubMed
-
- Bick T, Youdim MB, Hochberg Z. Adaptation of liver membrane somatogenic and lactogenic growth hormone (GH) binding to the spontaneous pulsation of GH secretion in the male rat. Endocrinology 125:1711–1717, 1989 - PubMed
-
- Black JL, Oliver BG, Roth M. Molecular mechanisms of combination therapy with inhaled corticosteroids and long-acting β-agonists. Chest 136:1095–1100, 2009 - PubMed
-
- Boldea V, Sharp GC, Jiang SB, Sarrut D. 4D-CT lung motion estimation with deformable registration: quantification of motion nonlinearity and hysteresis. Med Phys 35:1008–1018, 2008 - PubMed
Publication types
MeSH terms
Substances
Grants and funding
LinkOut - more resources
Full Text Sources
Medical
Miscellaneous