Comparative Study
. 2011 Jan 27;117(4):e49-56.
doi: 10.1182/blood-2010-10-314120. Epub 2010 Nov 17.

mpeg1 promoter transgenes direct macrophage-lineage expression in zebrafish

Affiliations
Comparative Study

mpeg1 promoter transgenes direct macrophage-lineage expression in zebrafish

Felix Ellett et al. Blood. .

Abstract

Macrophages and neutrophils play important roles during the innate immune response, phagocytosing invading microbes and delivering antimicrobial compounds to the site of injury. Functional analyses of the cellular innate immune response in zebrafish infection/inflammation models have been aided by transgenic lines with fluorophore-marked neutrophils. However, it has not been possible to study macrophage behaviors and neutrophil/macrophage interactions in vivo directly because there has been no macrophage-only reporter line. To remove this roadblock, a macrophage-specific marker was identified (mpeg1) and its promoter used in mpeg1-driven transgenes. mpeg1-driven transgenes are expressed in macrophage-lineage cells that do not express neutrophil-marking transgenes. Using these lines, the different dynamic behaviors of neutrophils and macrophages after wounding were compared side-by-side in compound transgenics. Macrophage/neutrophil interactions, such as phagocytosis of senescent neutrophils, were readily observed in real time. These zebrafish transgenes provide a new resource that will contribute to the fields of inflammation, infection, and leukocyte biology.


Figures
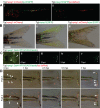
Figure 1
Figure 1
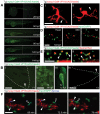
A 1.86-kb mpeg1 promoter fragment drives transient transgene expression in macrophages. (A) Transient mosaic transgene expression in embryos injected with tol2-flanked Tg(mpeg1:mCherry) (i) and Tg(mpeg1:EGFP) (ii) DNA constructs into Tg(lyz:EGFP) and Tg(lyz:dsRed) transgenic backgrounds, respectively. The experiment was conducted on Tg(lyz:EGFP) and Tg(lyz:dsRed) embryos to provide comparison and nonoverlap of expression with neutrophils. (B) Transgene expression in F0 adults injected with tol2-flanked Tg(mpeg1:mCherry) (i,iii) and Tg(mpeg1:EGFP) (ii) DNA constructs. (iii) Tg(mpeg1:mCherry) was introduced onto the Tg(mpx:EGFP) background to provide comparison and nonoverlap of expression with neutrophils. (C) Transient transgene expression resulting from delivery of a tol2-flanked Tg(mpeg1:Gal4-VP16) construct into Tg(UAS:Kaede) embryos results in expression of Kaede in dispersed cells (i) that migrate in response to wounding (tail transection) (ii-v). Time: hours post injury (hpi). (D) Delivery of tol2-flanked Tg(mpeg1:Gal4-VP16) into Tg(UAS:Kaede/lyz:dsRed) embryos allows comparison of macrophage (green, arrowheads) and neutrophil populations (red) migrating in response to wounding (tail transection). Time: hours post injury (hpi).
Figure 2
Figure 2
Macrophage ontology, morphology, and behavior in stable mpeg1 transgenic zebrafish. (A) Unconverted Kaede expression (green) in dispersed macrophages in Tg(mpeg1:Gal4-VP16/UAS:Kaede) F1 embryos from 28 to 144 hpf. Images at 28, 50, and 120 hpf are composites assembled from photographs of the same embryo taken in 2 focal planes. (B) Loss of transgene expression occurs in young F1 and F2 Tg(mpeg1:Gal4-VP16/UAS:Kaede) adults (i,iv), demonstrated by the absence of dispersed fluorescent macrophages in the tail fin; compare with macrophages in the tail fins of Tg(mpeg1:mCherry) and Tg(mpeg1:EGFP) F0 animals in Figure 1B. However, the direct offspring of an outcross of the F1 adult (i) still shows strong embryonic transgene expression in dispersed macrophages (ii,iii). (I,iv) Arrowheads indicate autofluorescent iridophores. Bar represents 1 mm. (C) Dendritic morphology (arrowheads) of photoconverted Kaede (red) marked cells in Tg(mpeg1:Gal4-VP16/UAS:Kaede) F1 embryos. Bar represents 20 μm. (D) No overlap of fluorophore expression was observed between photoconverted Kaede and EGFP in F1 Tg(mpeg1:Gal4-VP16/UAS:Kaede/mpx:EGFP) compound transgenic embryos, demonstrating that the mpeg1 promoter drives expression in an entirely separate myeloid cell population to that of the mpx promoter (green represents neutrophils; and red, macrophages). Bar represents 50 μm. (E) Macrophage pinocytosis leads to accumulation of neutral red staining in vacuoles of unconverted Tg(mpeg1:Gal4-VP16/UAS:Kaede) positive cells (green) in the brain (arrowheads) of F1 embryos. Bar represents 50 μm. (F) Phagocytosis of heat-killed Penicillium marneffei spores (calcofluor-labeled, blue, arrowhead) by macrophages (red represents photoconverted Kaede) and neutrophils (green represents EGFP). Note phagocytosis of lower fungal spore by macrophage (bottom filled arrowhead) and migration of neutrophil with intracellular spore (open arrowhead). Stills from supplemental Video 1. Bar represents 50 μm. Time: minutes after infection.
Figure 3
Figure 3
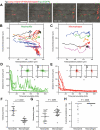
Comparative descriptive and quantitative analysis of macrophage and neutrophil behavior after wounding. (A) Frames extracted from 11.5 hours of time lapse microscopy (supplemental Video 2) after tail transection in a Tg(mpeg1:Gal4-VP16/UAS:Kaede/mpx:EGFP) F1 embryo (red represents macrophages; and green, neutrophils). Bar represents 100 μm. (B-C) Cell migration paths for the first 6 neutrophils (B) and 6 macrophages (C) to arrive at the wound, followed for 18 hours after tail transection, extracted from a video of another wounded Tg(mpeg1:Gal4-VP16/UAS:Kaede/mpx:EGFP) F1 transgenic embryo. (D-H) Graphing of distance to wound edge for the same 6 neutrophils (D) and macrophages (E) as in panels B and C demonstrates an overall difference in migratory and dwelling behaviors. All macrophages migrate directly to the wound and remain near the wound edge for the remainder of the time course, whereas approximately 30% of neutrophils resume a roaming behavior from 3 to 6 hours after wounding. Insets i and ii for each panel present collected x/y movement vectors before (i) and after (ii) wound arrival. Strong directionality is demonstrated by both cell types before arrival, but macrophages move with a slower prearrival velocity (F) and with a stronger directionality reflected by their higher meandering index (direct path length/actual path length) (G). In-wound persistence index, the percentage of remaining time spent at the wound edge after arrival (H), demonstrates the propensity of macrophages to remain in the wound margin for long periods after their arrival, whereas neutrophils show a significantly larger spread of behaviors. Descriptive statistics: (B-E) Data for the same 6 cells of each type. (F-H) Data points are individual cells from 4 embryos imaged for 18 hours after wounding. (F,G) Bars represent mean plus or minus SD. Tests of significance: (F,G) t test, 2-tailed. (H) Mann-Whitney test, 2-tailed.
Figure 4
Figure 4
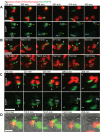
Interactions between macrophages and neutrophils in vivo. (A) Interactions between macrophages (red represents photoconverted Kaede) and neutrophils (green represents EGFP) in Tg(mpeg1:Gal4-VP16/UAS:Kaede/mpx:EGFP) compound transgenic F1 embryos. Two examples of apoptotic neutrophils being phagocytosed by macrophages at the wound margin. The first occurs at 340 minutes by macrophage 1 (Mϕ-1) at the top of frame followed by the second at 348 minutes by Mϕ-2. Loss of green neutrophil fluorescence is evident in the Mϕ-1 after 76 minutes and within Mϕ-2 occurs in 45 minutes. Stills from supplemental Video 3. Bar represents 10 μm. (B) Demonstration that the loss of cytoplasmic neutrophil fluorescence is dependent on macrophage phagocytosis. At 568 to 571 minutes, partial phagocytosis of a segment of a neutrophil. At 572.5 to 634 minutes, loss of fluorescence in the phagocytosed fragment occurs after approximately 6 hours (dotted circle represents region of lost EGFP fluorescence). Providing an internal control for this process, an unphagocytosed still-fluorescing neutrophil fragment remains stationary throughout the first phagocytic phase, until it is subsequently engulfed by the same macrophage at 727.5 minutes, with loss of its EGFP fluorescence at 736.5 minutes. Stills from supplemental Video 4. Bar represents 10 μm. In both panels, white arrowheads and yellow arrowheads indicate unphagocyted and phagocytosed states, respectively, of neutrophil corpse. (C-D) Two examples of cytoplasmic transfer from live neutrophils (green represents EGFP) to macrophages (red represents photoconverted Kaede). (C) A neutrophil/macrophage interaction near a wound margin results in a cytoplasmic fragment from a live neutrophil transferring to within a macrophage. (Top panel) Merged images. (Bottom panel) EGFP channel only. Dashed outlines indicate position of macrophage (blue) and neutrophil/fragment. Stills extracted from supplemental Video 5. Bar represents 20 μm. (D) A neutrophil/macrophage interaction in the trunk of the embryo. Merged fluorescence and bright-field images clearly demonstrate interaction resulting in cytoplasm transfer from neutrophil to macrophage. Stills from supplemental Video 6. Bar represents 20 μm. In both examples, white arrowheads and yellow arrowheads indicate unphagocytosed and phagocytosed states, respectively, of the transferring neutrophil cytoplasmic fragment. Neutrophil viability throughout the process is demonstrated by its subsequent migration out of the field of view (direction of white arrow in subpanels iv and v).

References

    1. Soehnlein O, Lindbom L. Phagocyte partnership during the onset and resolution of inflammation. Nat Rev Immunol. 2010;10(6):427–439. - PubMed
    1. van der Sar AM, Appelmelk BJ, Vandenbroucke-Grauls CM, Bitter W. A star with stripes: zebrafish as an infection model. Trends Microbiol. 2004;12(10):451–457. - PubMed
    1. Renshaw SA, Loynes CA, Trushell DM, Elworthy S, Ingham PW, Whyte MK. A transgenic zebrafish model of neutrophilic inflammation. Blood. 2006;108(13):3976–3978. - PubMed
    1. Mathias JR, Perrin BJ, Liu TX, Kanki J, Look AT, Huttenlocher A. Resolution of inflammation by retrograde chemotaxis of neutrophils in transgenic zebrafish. J Leukoc Biol. 2006;80(6):1281–1288. - PubMed
    1. Hall C, Flores MV, Storm T, Crosier K, Crosier P. The zebrafish lysozyme C promoter drives myeloid-specific expression in transgenic fish. BMC Dev Biol. 2007;7:42. - PMC - PubMed

Publication types