

Cardiac mechanoenergetic cost of elevated plasma viscosity after moderate hemodilution
- PMID: 21084746
- PMCID: PMC4130999
- DOI: 10.3233/BIR-2010-0574
Cardiac mechanoenergetic cost of elevated plasma viscosity after moderate hemodilution
Abstract
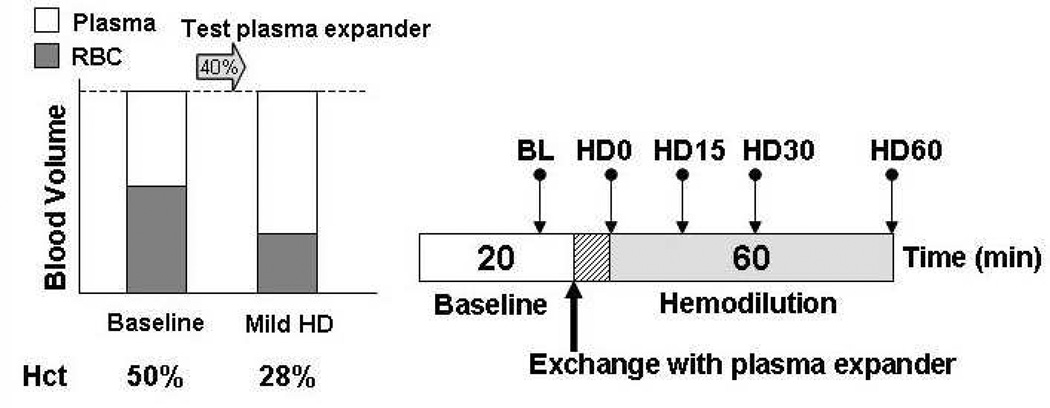
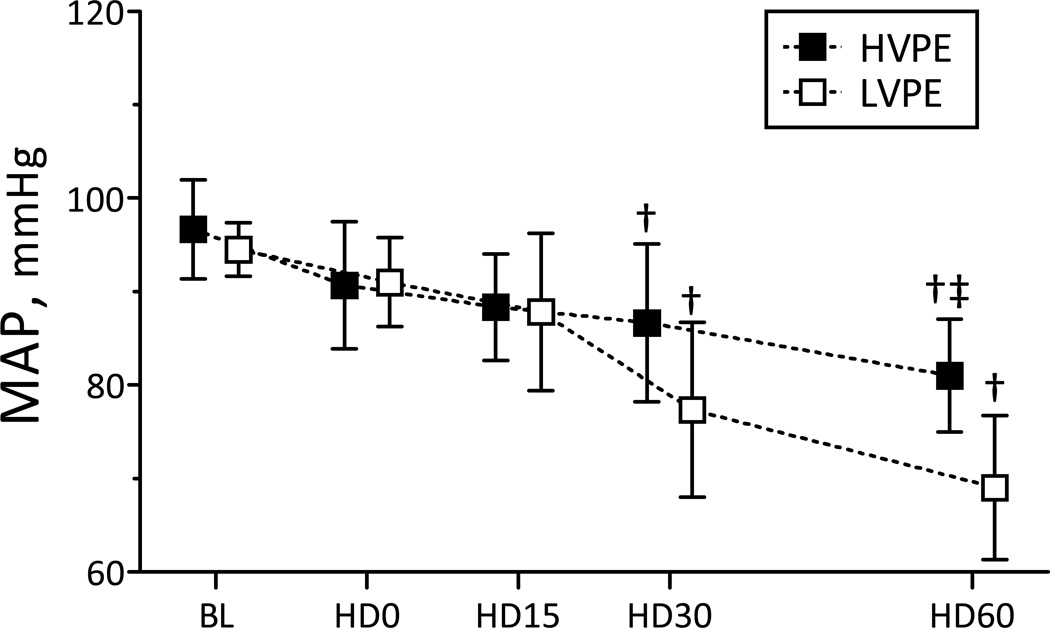
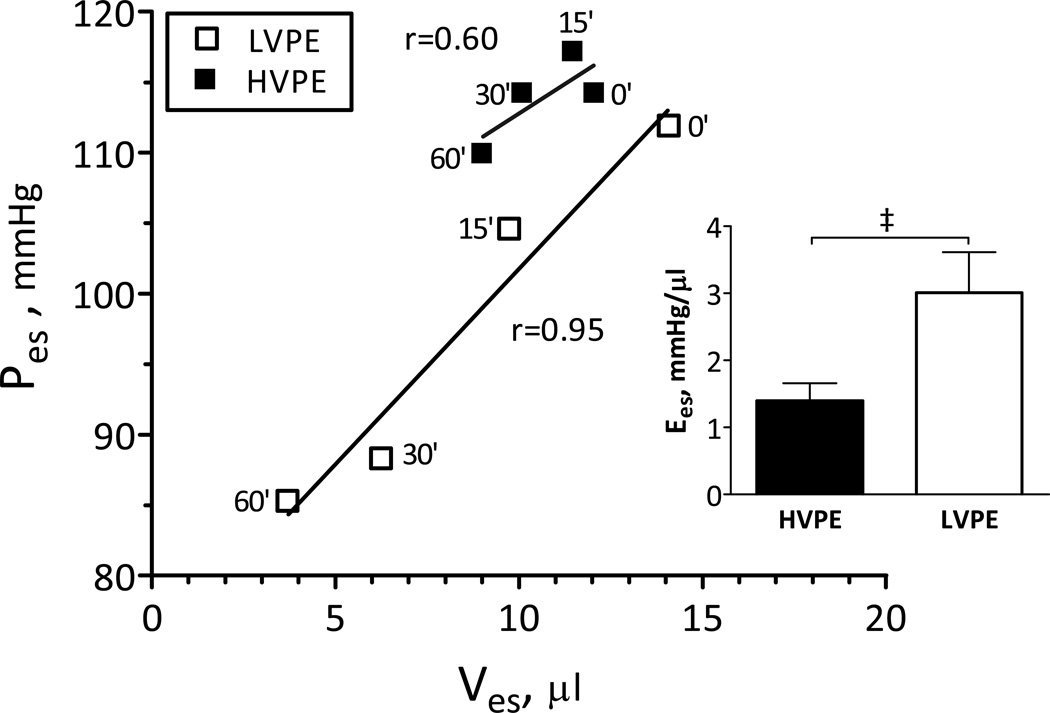
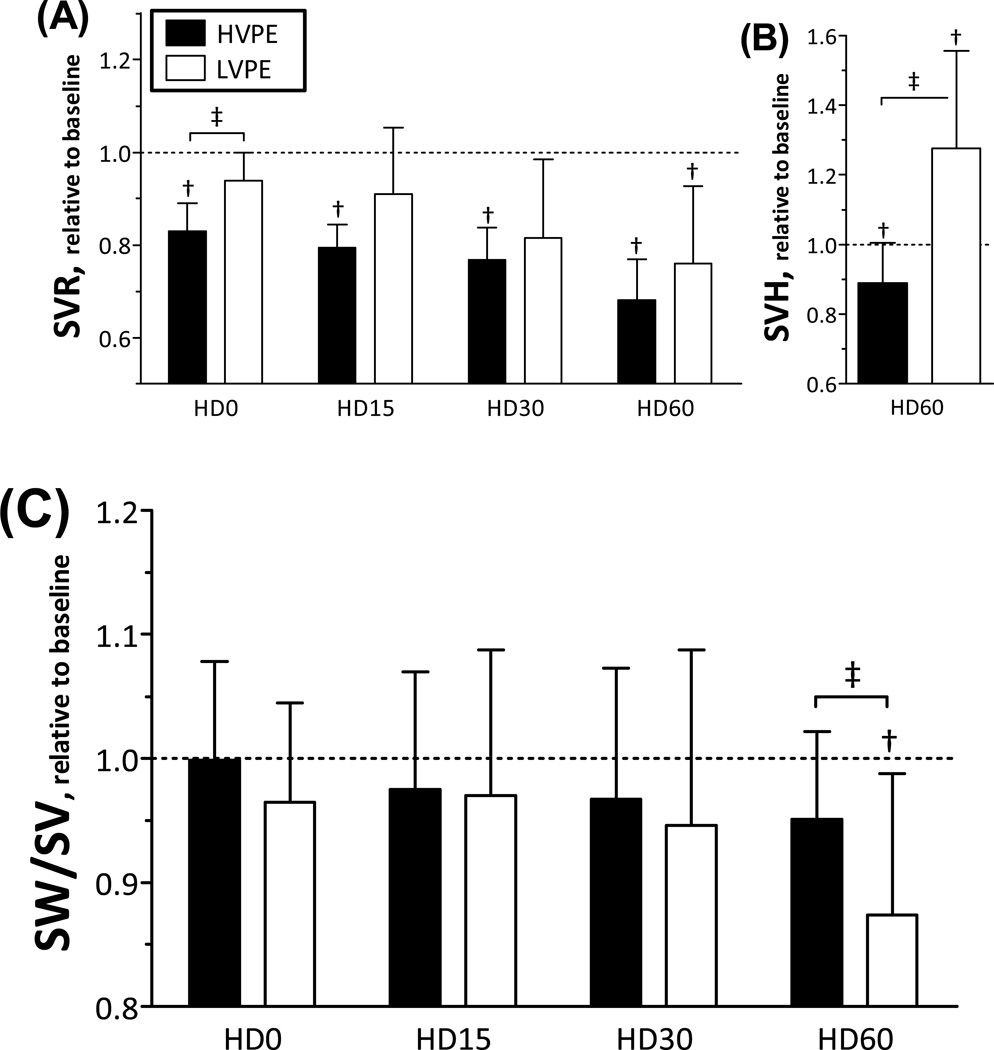
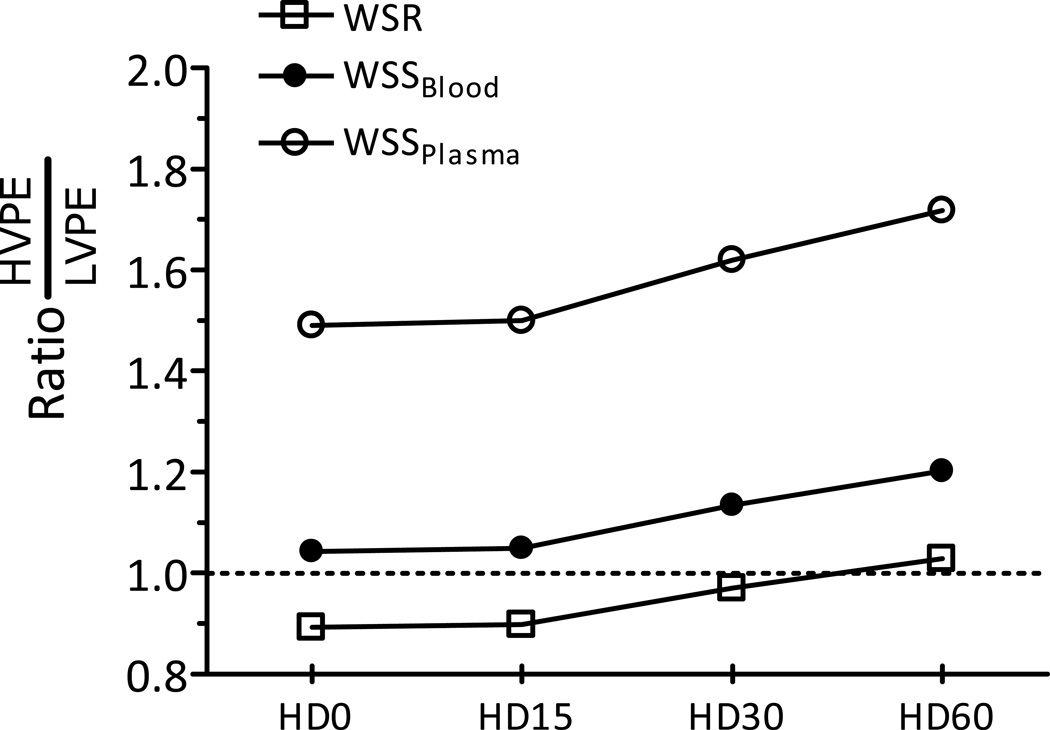
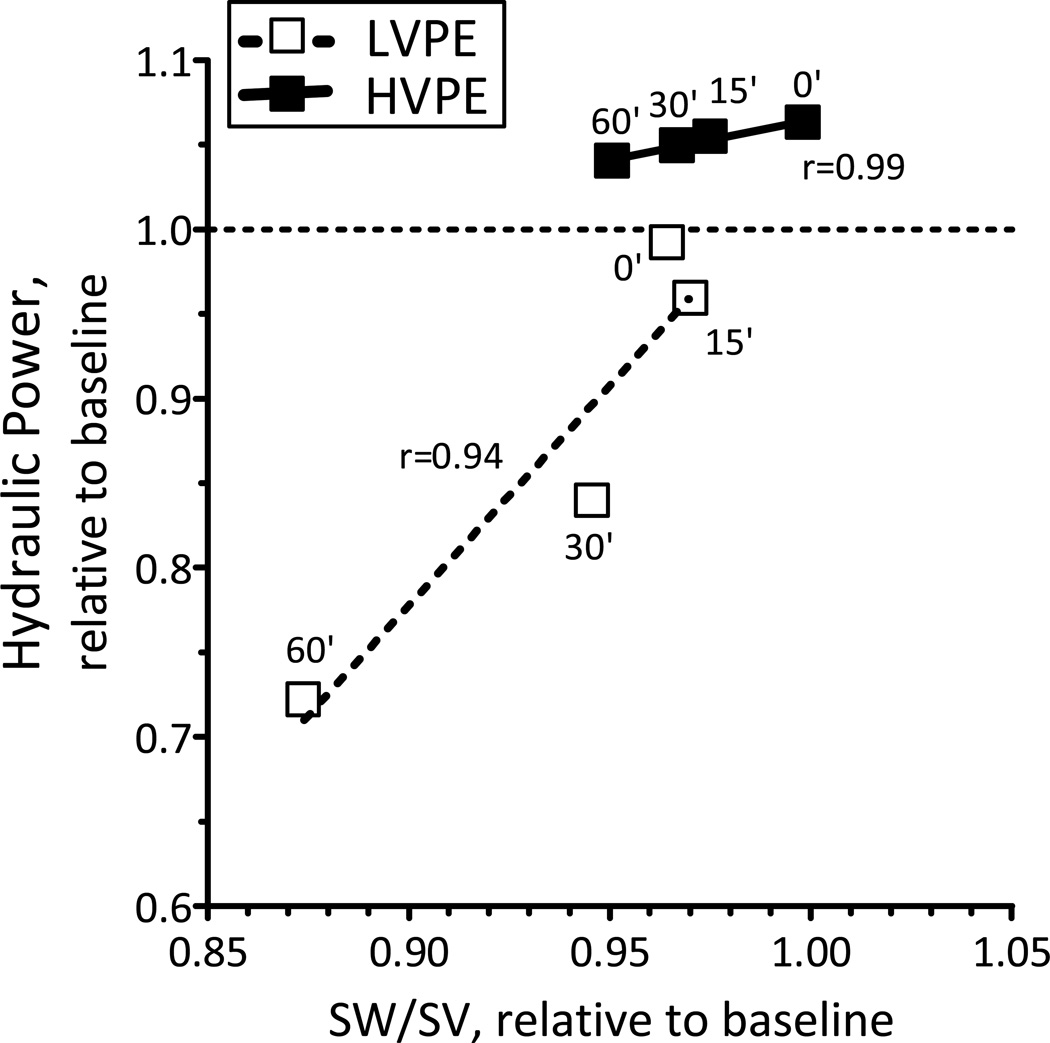
The purpose of this study was to investigate how plasma viscosity affects cardiac and vascular function during moderate hemodilution. Twelve anesthetized hamsters were hemodiluted by 40% of blood volume with two different viscosity plasma expanders. Experimental groups were based on the plasma expander viscosity, namely: high viscosity plasma expander (HVPE, 6.3 mPa · s) and low viscosity plasma expander (LVPE, 2.2 mPa · s). Left ventricular (LV) function was intracardiacally measured with a high temporal resolution miniaturized conductance catheter and concurrent pressure-volume results were used to calculate different LV indices. Independently of the plasma expander, hemodilution decreased hematocrit to 28% in both groups. LVPE hemodilution reduced whole blood viscosity by 40% without changing plasma viscosity, while HVPE hemodilution reduced whole blood viscosity by 23% and almost doubled plasma viscosity relative to baseline. High viscosity plasma expander hemodilution significantly increased cardiac output, stroke volume and stroke work compared to baseline, whereas LVPE hemodilution did not. Furthermore, an increase in plasma viscosity during moderate hemodilution produced a higher energy transfer per unit volume of ejected blood. Systemic vascular resistance decreased after hemodilution in both groups. Counter-intuitively, HVPE hemodilution showed lower vascular resistance and vascular hindrance than LVPE hemodilution. This result suggests that geometrical changes in the circulatory system are induced by the increase in plasma viscosity. In conclusion, an increase in plasma viscosity after moderate hemodilution directly influenced cardiac and vascular function by maintaining hydraulic power and reducing systemic vascular resistance through vasodilation.
Figures
References
-
- Alyono D, Ring WS, Chao RY, Alyono MM, Crumbley AJ, Larson EV, Anderson RW. Characteristics of ventricular function in severe hemorrhagic shock. Surgery. 1983;94:250–258. - PubMed
-
- Baan J, van der Velde ET, de Bruin HG, Smeenk GJ, Koops J, van Dijk AD, Temmerman D, Senden J, Buis B. Continuous measurement of left ventricular volume in animals and humans by conductance catheter. Circulation. 1984;70:812–823. - PubMed
-
- Cabrales P, Martini J, Intaglietta M, Tsai AG. Blood viscosity maintains microvascular conditions during normovolemic anemia independent of blood oxygen-carrying capacity. Am J Physiol Heart Circ Physiol. 2006;291:H581–H590. - PubMed
-
- Cabrales P, Tsai AG, Intaglietta M. Alginate plasma expander maintains perfusion and plasma viscosity during extreme hemodilution. Am J Physiol Heart Circ Physiol. 2005;288:H1708–H1716. - PubMed
Publication types
MeSH terms
Grants and funding
LinkOut - more resources
Full Text Sources
Other Literature Sources
