. 2010 Dec;120(12):4273-88.
doi: 10.1172/JCI43274. Epub 2010 Nov 15.

Transplantation of mouse HSCs genetically modified to express a CD4-restricted TCR results in long-term immunity that destroys tumors and initiates spontaneous autoimmunity

Affiliations

Transplantation of mouse HSCs genetically modified to express a CD4-restricted TCR results in long-term immunity that destroys tumors and initiates spontaneous autoimmunity

Sung P Ha et al. J Clin Invest. 2010 Dec.

Abstract

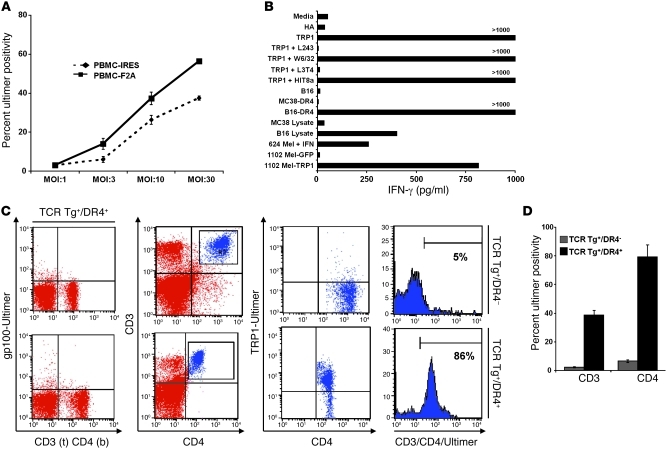
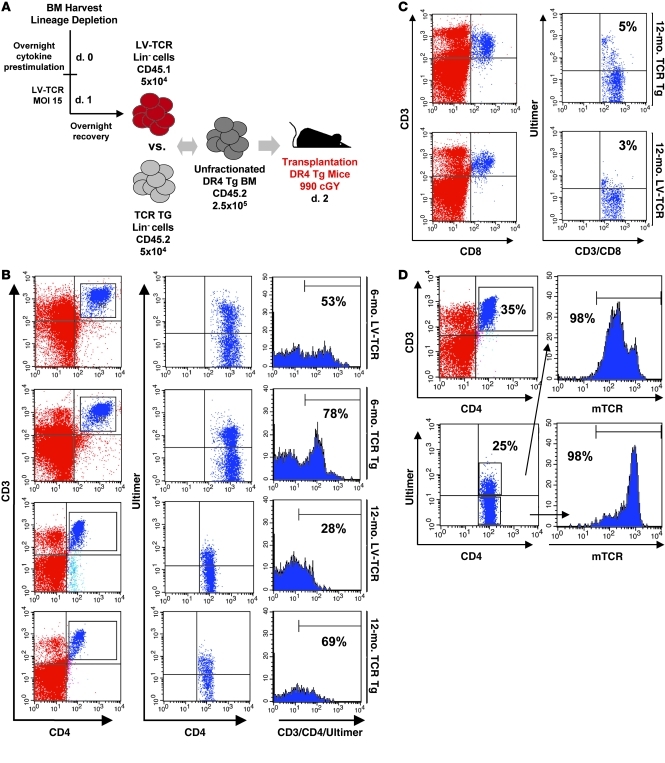
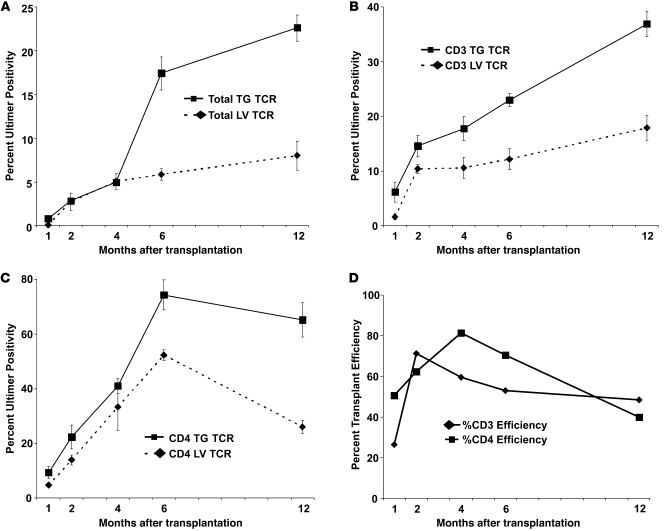
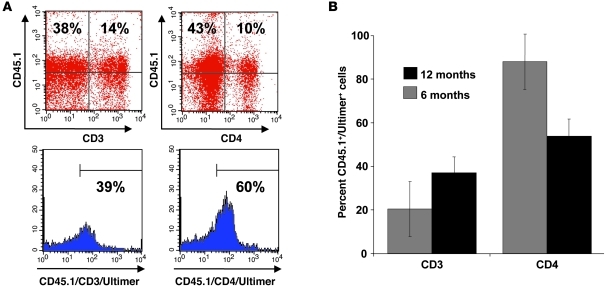
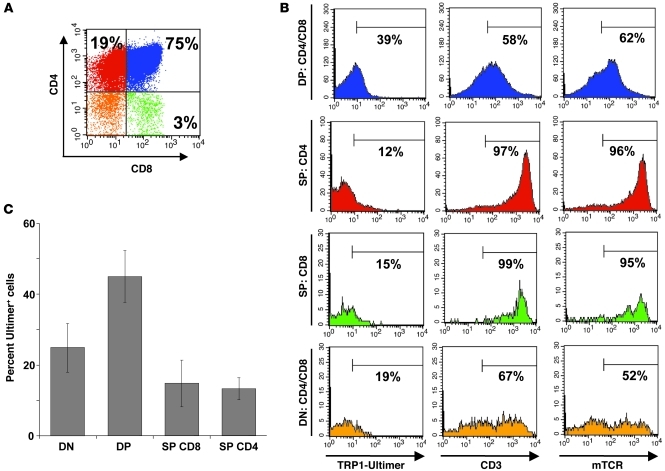
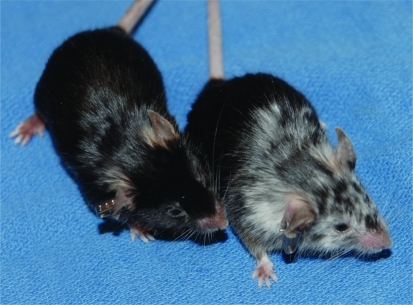
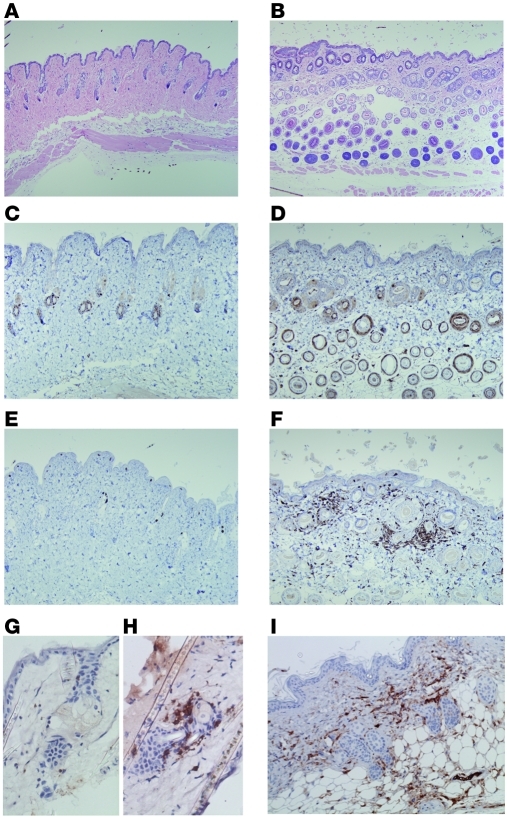
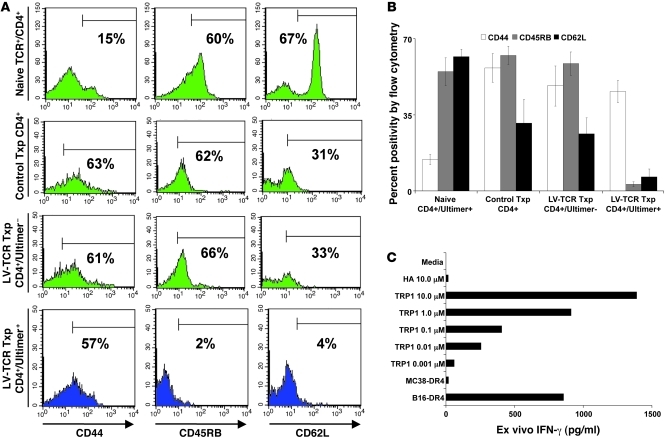
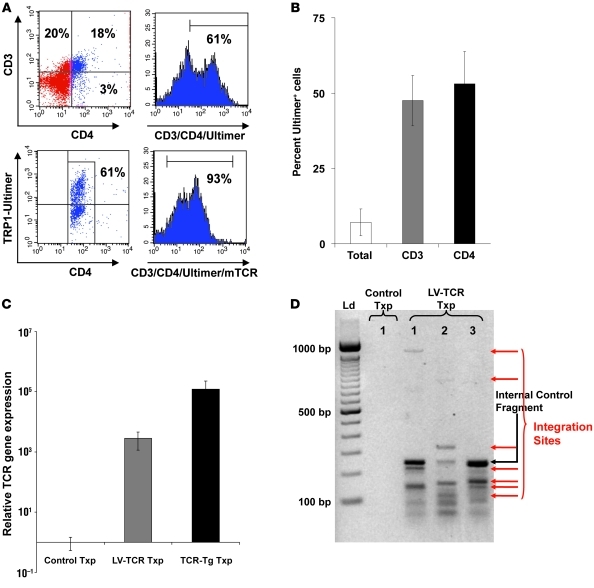
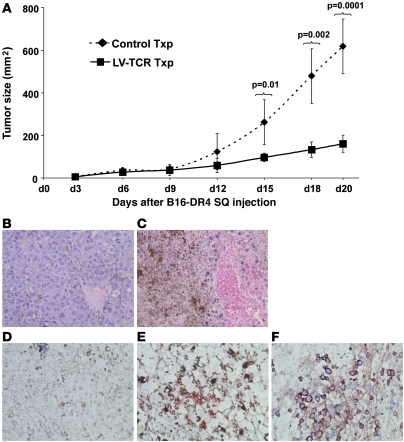
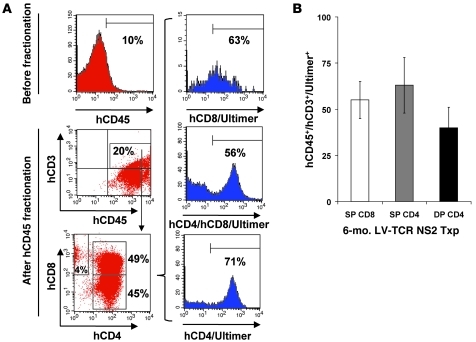
The development of effective cancer immunotherapies has been consistently hampered by several factors, including an inability to instigate long-term effective functional antitumor immunity. This is particularly true for immunotherapies that focus on the adoptive transfer of activated or genetically modified mature CD8+ T cells. In this study, we sought to alter and enhance long-term host immunity by genetically modifying, then transplanting, mouse HSCs. We first cloned a previously identified tumor-reactive HLA-DR4-restricted CD4+ TCR specific for the melanocyte differentiation antigen tyrosinase-related protein 1 (Tyrp1), then constructed both a high-expression lentivirus vector and a TCR-transgenic mouse expressing the genes encoding this TCR. Using these tools, we demonstrated that both mouse and human HSCs established durable, high-efficiency TCR gene transfer following long-term transplantation into lethally irradiated mice transgenic for HLA-DR4. Recipients of genetically modified mouse HSCs developed spontaneous autoimmune vitiligo that was associated with the presence of a Th1-polarized memory effector CD4+ T cell population that expressed the Tyrp1-specific TCR. Most importantly, large numbers of CD4+ T cells expressing the Tyrp1-specific TCR were detected in secondary HLA-DR4-transgenic transplant recipients, and these mice were able to destroy subcutaneously administered melanoma cells without the aid of vaccination, immune modulation, or cytokine administration. These results demonstrate the creation of what we believe to be a novel translational model of durable lentiviral gene transfer that results in long-term effective immunity.


Figures

Figure 1
Figure 1. DR4-restricted, Tyrp1-specific TCR is expressed and functional.
(A) At an increasing viral MOI, lentivector containing the F2A gene was superior to IRES in generating stable TCR heterodimers in human PBMCs. Cell surface expression of the Tyrp1-specific TCR was determined by flow cytometry using a PE-labeled DR4 Ultimer containing the Tyrp1277–297 epitope. At MOI 30: 37.5% ± 1.5% versus 56.4% ± 1.1% (P = 0.0008). hCD45, human CD45. (B) PBMCs transduced with LV-TRP1-F2A (LV-TCR) were functionally specific. Specific IFN-γ production detected by ELISA to the specific peptide (Tyrp1277–297), lysate (B16 lysate), and intact tumors (B16-DR4, 624 Mel pretreated with IFN-γ, and 1102 Mel stably transduced with Tyrp1), but not to the control peptide (HA306–318), lysate (MC38), or tumors (wild-type B16, MC38-DR4, and 1102 Mel stably transduced with GFP). Interactions with Tyrp1277–297–pulsed targets were blocked by L243 (HLA-DR) and L3T4 (CD4), but not W6/32 (class I) or HIT8a (CD8) antibodies. Peptides were pulsed onto DR4+ 1088 EBV-B cells at 50 μM for 3 hours. Txp, transplant. (C) TCR Tg mice crossed with DR4 Tg mice strongly expressed the gene-specific TCR. Flow cytometry analysis (CD3/CD4/Tyrp1 Ultimer) of TCR+DR4+ and TCR+DR4 mice. Control staining of TCR+DR4+ with a gp100 Ultimer is shown. (D) Summary of PB TCR gene expression in TCR+DR4+ and TCR+DR4 mice within CD3 and CD4 compartments: CD4, 79% ± 8.3% versus 6.4% ± 1.0%; P < 0.0001. Data (mean ± SEM with P value; n = 5–7 per group) and flow cytometry are representative of 2–3 independent experiments.
Figure 2
Figure 2. LV gene–modified HSCs functionally engraft and repopulate transplant recipients over the long term.
(A) Overview of transplant procedure. Lin cells were isolated and transduced with LV-TCR. Competitive reconstitution was performed using transduced Lin cells (CD45.1, 5 × 10⁴) combined with congenic BM cells (CD45.2, 2.5 × 10⁵) from DR4 Tg mice, then transplanted into irradiated DR4 Tg recipients. A parallel arm involving Lin cells (5 × 10⁴) from TCR Tg mice combined with unfractionated BM (2.5 × 10⁵) from DR4 transgenic mice was transplanted into similarly irradiated hosts. (B) Flow cytometry analysis of PB at 6 and 12 months demonstrated high-level TCR gene expression: CD45+CD3+CD4+Tyrp1 Ultimer+ staining of LV-TCR and TCR Tg transplant groups. (C) Flow cytometry analysis of PB at 12 months demonstrated low-level TCR gene expression within CD8 compartment: CD45+CD3+CD8+Tyrp1 Ultimer+ staining of LV-TCR and TCR Tg transplant groups. (D) Flow cytometry analysis of PB at 12 months demonstrated high-level co-expression of the murine TCRβ chain in both CD4+Ultimer+ and CD4+Ultimer subpopulations. Data are representative of flow cytometry studies done on 4 separate transplant experiments.
Figure 3
Figure 3. Summary results of 12-month primary transplants.
(A) Twelve-month transplant summary of TCR gene expression in LV-TCR and TCR Tg groups within the total cellular compartment as measured by evaluation of 10,000 gated events from PB. At 12 months, 8% ± 1.7% versus 22.6% ± 1.5%; P = 0.001. (B) Twelve-month transplant summary of TCR gene expression in LV-TCR and TCR Tg groups within CD3 compartment. At 12 months, 17.8% ± 2.3% versus 36.7% ± 2.4%; P = 0.006. (C) Twelve-month transplant summary of TCR gene expression in LV-TCR and TCR Tg groups within CD4 compartment. At 12 months, 26.1% ± 2.4% versus 65.2% ± 6.3%; P = 0.004. (D) Twelve-month transplant summary of TCR gene transfer efficiency (% = LV-TCR/TCR Tg × 100) within CD3 and CD4 compartments. Data (mean ± SEM with P value; n = 5–10 per group) are representative of 3–4 independent experiments.
Figure 4
Figure 4. TCR gene-specific T cells represent a dominant fraction of all lymphocytes within the CD45.
subcompartment. (A) Flow cytometry analysis of PB at 12 months post-transplantation demonstrated high-level TCR gene expression: CD45.1+CD3+Tyrp1 Ultimer+ and CD45.1+CD4+Tyrp1 Ultimer+ staining of LV-TCR transplants. (B) Six- and 12-month transplant summary of TCR gene expression within the CD3 and CD4 subpopulation as a function of CD45.1-gated cells. At 12 months: CD3, 37% ± 7.4%; CD4, 54% ± 7.8%; P = 0.04. Data (mean ± SEM with P value; n = 5–10 per group) and flow cytometry are representative of 2 independent experiments.
Figure 5
Figure 5. One year after transplantation, high-level TCR expression is identified within thymocyte subpopulations.
(A and B) Flow cytometry analysis of thymocytes at 12 months after LV-TCR transplantation demonstrated intact co-expression of endogenous murine TCR complex and TCR transgene within SP, DP, and DN subpopulations: CD45+, CD3+, CD4+, CD8+, murine TCRβ+, and Tyrp1 Ultimer+ staining. (C) Summary of TCR gene expression in DN, DP, SP CD8, and SP CD4 subpopulations: DP 45% ± 7.3% versus SP CD4 13.3% ± 3.1%; P = 0.002. Data (mean ± SEM with P value; n = 4–6 per group) and flow cytometry are representative of 3 independent experiments.
Figure 6
Figure 6. LV-TCR transplant recipients develop spontaneous autoimmune vitiligo.
DR4 Tg mice transplanted with LV-TCR–transduced HPCs (right mouse) developed autoimmune vitiligo at 10 weeks, but the control transplants (left mouse) did not.
Figure 7
Figure 7. Vitiligo is associated with gross distortion of the natural skin architecture, melanocyte destruction, and TCR gene–specific CD4+ T cell infiltration.
(AI) IHC analysis of paraffin-embedded and frozen skin sections from control and LV-TCR transplants 6 months after transplantation. (A and B) H&E staining (original magnification, ×100), (C and D) S-100 staining (original magnification, ×200), (E and F) CD3 staining (original magnification, ×200), (G and H) CD8 versus CD4 staining on frozen sections of LV-TCR only (original magnification, ×400), and (I) human TCRβ staining of LV-TCR only (original magnification, ×200). IHC was performed on more than 4 independent sample groups with equivalent results.
Figure 8
Figure 8. Transplant recipients exhibit a TEM phenotype and react spontaneously to tumor ex vivo.
(A) PB samples at 6 months post-transplantation were obtained and stained with antibodies against CD4, Tyrp1 Ultimer, CD44, CD45RB, and CD62L. LV-TCR transplant CD4+Ultimer+ cells exhibited a TEM phenotype (CD45RBloCD62LloCD44hi), while the polyclonal CD4+Ultimer and CD4+ control population exhibited a more generalized effector profile (CD45RBhiCD62LintCD44hi), in contrast with naive CD4+Ultimer+ cells (CD45RBhiCD62LhiCD44lo) from endogenous nontransplanted TCR Tg. (B) Summary of activation status of all CD4+ subpopulations. (C) Gene-modified T cells exhibited a Th1-polarized cytokine profile in response to specific peptide and tumor. Splenocytes from 6-month-old LV-TCR and LV-GFP transplants were stimulated ex vivo for 24 hours with peptide (Tyrp1277–297 or HA306–318) or tumor (MC38-DR4 or B16-DR4). Cytokine release (IFN-γ) was measured by ELISA. Data (mean ± SEM; n = 5 per group) and flow cytometry are representative of 3 independent experiments.
Figure 9
Figure 9. CD4+ T cells from secondary transplant recipients exhibit high-level gene TCR expression and multi-copy integration of the LV-TCR gene product.
PB from 6-month secondary transplants were stained with antibodies against CD4, CD8, CD3, and Tyrp1 Ultimer and analyzed by flow cytometry. (A) TCR-specific CD4+ T cells were identified at a level of 61% within the CD4 subcompartment (CD3+CD4+Ultimer+). Co-expression (93%) of endogenous murine TCRβ was also observed in the CD4+Ultimer+ subpopulation. (B) Summary of 6-month TCR gene expression within secondary transplant. Total, CD3, and CD4 populations: 7.1% ± 4.5% within the total cellular compartment (CD45+Ultimer+), 47.5% ± 8.3% within the global CD3 compartment (CD45+CD3+Ultimer+), and 53.1% ± 10.7% within the CD4 subcompartment (CD45+CD3+CD4+Ultimer+). (C) Relative TCR gene expression was more than 1,000-fold greater than control transplants but 43-fold less than TCR Tg transplant (P = 0.01). gDNA was prepared from BM obtained from 6-month-old secondary LV-TCR and control transplants and 12-month-old primary TCR Tg transplants and analyzed by qPCR for relative TCR gene expression using an α-chain-specific probe. Relative gene expression is displayed; error bars indicate the 95% confidence interval. (D) Multicopy integration of the LV-TCR gene product was found in secondary transplant recipients. Using a vector backbone–specific probe, 4–6 integration sites were identified in 3 separate LV-TCR transplant samples compared with control. Data (mean ± SEM; n = 5 per group) and flow cytometry are representative of 2 independent experiments.
Figure 10
Figure 10. Six-month secondary TCR transplant recipients reject subcutaneous melanoma.
(A) LV-TCR and control transplants (5 mice per group) were subcutaneously injected with 5 × 10⁵ B16-DR4 tumor cells. Three days after injection, tumor size was recorded. Statistical significance between groups was based on tumor size. Data are displayed as mean ± SEM with P value; n = 5 per group. Experiments were performed in a blinded, randomized fashion and executed independently 3 times. (B and C) Tumors from LV-TCR transplants were necrotic. IHC staining of paraffin-embedded tumor (control and LV-TCR) specimens: H&E staining; original magnification, ×400. (DF) Tumors from LV-TCR transplants were associated with a dense TCR gene–specific infiltration: CD3 and human TCR-β staining; original magnification, ×400. NovaRED substrate was used instead of DAB (previously used on skin) to more effectively differentiate between necrotic tumor/pigment and cellular infiltrate. IHC was performed on 3 independent samples per group with similar results.
Figure 11
Figure 11. LV-TCR gene–modified human CD34+CD38 HPCs obtained from cord blood functionally engraft and repopulate 6-month-old NOD-SCID-IL2rγnull (NS2) transplant recipients.
(A) Flow cytometry analysis of splenocytes 6 months after transplantation demonstrated human CD45 expression (10%) as a function of all gated mononuclear cells (mouse and human; pre-fractionation sample) and post-fractionation expression of human CD45 and CD3. Human CD45/CD3/CD4 versus human CD45/CD3/CD8 expression demonstrated skewing toward CD4+ T cell differentiation (45% human CD3+/SP CD4+ versus 4% human CD3+/SP CD8+ versus 49% DP human CD3+CD4+CD8+). TCR gene levels were well expressed in all T cell subpopulations. (B) Six-month transplant summary of TCR gene expression within human SP CD8+ (55% ± 10%), SP CD4+ (63% ± 15%) and DP (51% ± 11%; P = NS) T cell subpopulations. Data (mean ± SEM; n = 5 per experiment) and flow cytometry are representative of 3 independent experiments.

Similar articles

Cited by

References

    1. Dudley ME, Rosenberg SA. Adoptive-cell-transfer therapy for the treatment of patients with cancer. Nat Rev Cancer. 2003;3(9):666–675. doi: 10.1038/nrc1167. - DOI - PMC - PubMed
    1. Morgan RA, et al. Cancer regression in patients after transfer of genetically engineered lymphocytes. Science. 2006;314(5796):126–129. doi: 10.1126/science.1129003. - DOI - PMC - PubMed
    1. Gattinoni L, Powell DJ, Jr, Rosenberg SA, Restifo NP. Adoptive immunotherapy for cancer: building on success. Nat Rev Immunol. 2006;6(5):383–393. doi: 10.1038/nri1842. - DOI - PMC - PubMed
    1. Lanzavecchia A, Sallusto F. Progressive differentiation and selection of the fittest in the immune response. Nat Rev Immunol. 2002;2(12):982–987. doi: 10.1038/nri959. - DOI - PubMed
    1. Rizzuto GA, et al. Self-antigen-specific CD8+ T cell precursor frequency determines the quality of the antitumor immune response. J Exp Med. 2009;206(4):849–866. doi: 10.1084/jem.20081382. - DOI - PMC - PubMed

Publication types

MeSH terms