. 2010 Dec;120(12):4316-31.
doi: 10.1172/JCI41624. Epub 2010 Nov 15.

Salt-inducible kinase 2 links transcriptional coactivator p300 phosphorylation to the prevention of ChREBP-dependent hepatic steatosis in mice

Affiliations

Salt-inducible kinase 2 links transcriptional coactivator p300 phosphorylation to the prevention of ChREBP-dependent hepatic steatosis in mice

Julien Bricambert et al. J Clin Invest. 2010 Dec.

Abstract

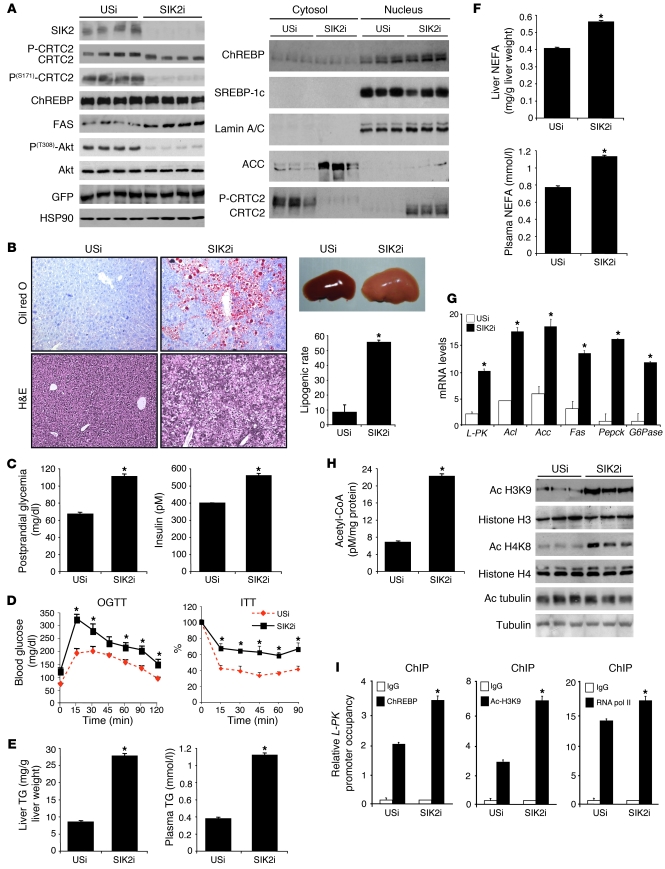
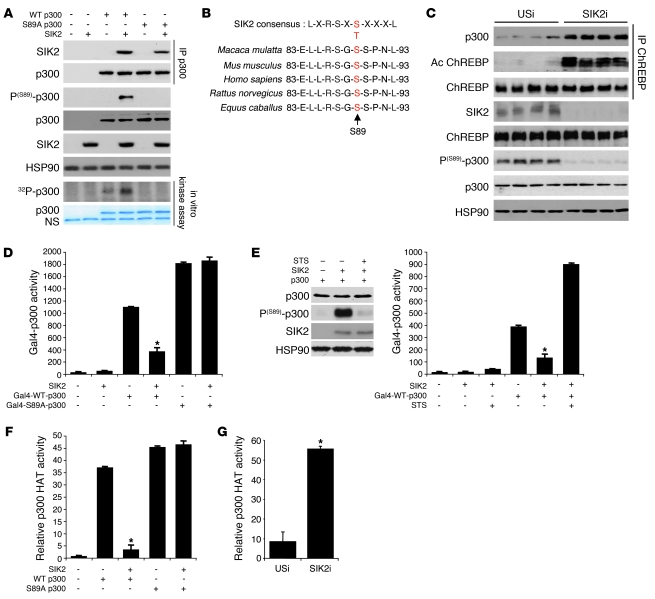
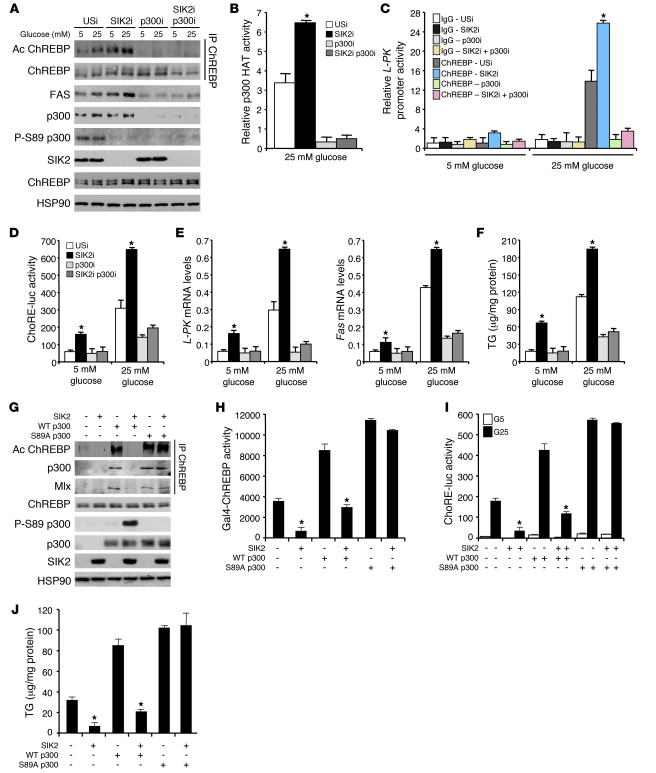
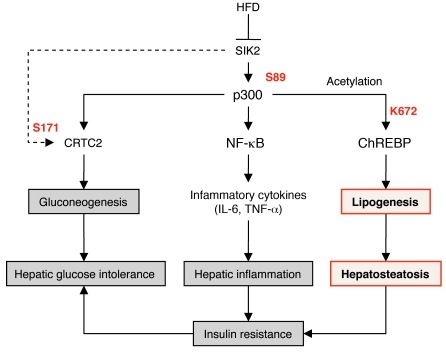
Obesity and type 2 diabetes are associated with increased lipogenesis in the liver. This results in fat accumulation in hepatocytes, a condition known as hepatic steatosis, which is a form of nonalcoholic fatty liver disease (NAFLD), the most common cause of liver dysfunction in the United States. Carbohydrate-responsive element-binding protein (ChREBP), a transcriptional activator of glycolytic and lipogenic genes, has emerged as a major player in the development of hepatic steatosis in mice. However, the molecular mechanisms enhancing its transcriptional activity remain largely unknown. In this study, we have identified the histone acetyltransferase (HAT) coactivator p300 and serine/threonine kinase salt-inducible kinase 2 (SIK2) as key upstream regulators of ChREBP activity. In cultured mouse hepatocytes, we showed that glucose-activated p300 acetylated ChREBP on Lys672 and increased its transcriptional activity by enhancing its recruitment to its target gene promoters. SIK2 inhibited p300 HAT activity by direct phosphorylation on Ser89, which in turn decreased ChREBP-mediated lipogenesis in hepatocytes and mice overexpressing SIK2. Moreover, both liver-specific SIK2 knockdown and p300 overexpression resulted in hepatic steatosis, insulin resistance, and inflammation, phenotypes reversed by SIK2/p300 co-overexpression. Finally, in mouse models of type 2 diabetes and obesity, low SIK2 activity was associated with increased p300 HAT activity, ChREBP hyperacetylation, and hepatic steatosis. Our findings suggest that inhibition of hepatic p300 activity may be beneficial for treating hepatic steatosis in obesity and type 2 diabetes and identify SIK2 activators and specific p300 inhibitors as potential targets for pharmaceutical intervention.


Figures

Figure 1
Figure 1. Hepatic SIK2 silencing impairs lipid homeostasis.
Mice were injected with unspecific (USi) or SIK2 shRNA adenovirus (SIK2i) and were studied 7 days later in the fed state. (A) Western blot analysis of key transcription factors and coactivators involved in the regulation of gluconeogenesis and lipogenesis in liver (n = 3–4 per group). (B) SIK2i mice develop hepatic steatosis as shown by increased liver size and H&E and oil red O staining of liver sections and by the rate of lipogenesis. Original magnification, ×200 (n = 4–8 per group; *P < 0.05). (C) Plasma glucose and insulin levels (n = 8 per group; *P < 0.01). (D) OGTT and ITT (n = 6 per group; *P < 0.01). (E and F) Total liver and plasma TGs and FFA levels (n = 8 per group; *P < 0.01). (G) Relative expression of glycolytic, lipogenic, and gluconeogenic genes (n = 8 per group; *P < 0.01). (H) Acetyl-CoA concentrations (n = 8 per group; *P < 0.02) and amounts of acetylated (Ac) H3K9, H4K8, and tubulin determined by Western blot analysis (n = 4 per group). (I) ChREBP, RNA polymerase II (RNA pol II) recruitment, and levels of acetylated H3K9 at the ChoRE-containing region of the L-PK promoter were measured by ChIP studies. The amount of immunoprecipitated H3 at the DNA was unchanged upon SIK2 silencing and was used as control to normalize H3K9 acetylation levels at the L-PK promoter (n = 8 per group; *P < 0.05). Data represent mean ± SEM.
Figure 2
Figure 2. SIK2 promotes p300 Ser89 phosphorylation and inhibits p300 activity.
(A) Top 2 panels: Coimmunoprecipitation assay from HepG2 cells using epitope-tagged p300 and SIK2 proteins. The amount of SIK2 recovered from IPs of p300 is shown. Middle 4 panels: Western blot analysis of p300 with specific anti–phospho-Ser89 antiserum after phosphorylation by SIK2. Bottom 2 panels: Autoradiograph showing phosphorylation of p300 at Ser89 by SIK2 in an in vitro kinase assay. Data are representative of 3 independent experiments. NS, nonspecific. (B) p300 phosphorylation site at Ser89 by SIK2 is conserved across eukaryotic species. (C) Western blot analysis of phosphorylated Ser89 p300 and acetylated ChREBP levels in liver of USi and SIK2i mice (n = 8 per group). (D) Measurement of Gal4-WT and S89A p300 activity in HepG2 cells overexpressing SIK2. Data are the average of 3 independent experiments (mean ± SEM; *P < 0.05). (E) Left: Western blot analysis of p300 Ser89 phosphorylation after STS treatment in HepG2 cells. Data are representative of 3 independent experiments. Right: Measurement of UAS-luciferase activity in HepG2 cells overexpressing Gal4-WT-p300 with SIK2 after STS treatment. Data are the average of 3 independent experiments (mean ± SEM; *P < 0.05). (F) Inhibition of p300 HAT activity via phosphorylation at Ser89 by SIK2. WT or S89A p300 were overexpressed in HepG2 cells with or without a SIK2 expression vector. p300 was then immunoprecipitated and used for HAT assays on core histone proteins. Data are the average of 3 independent experiments (mean ± SEM; *P < 0.05). (G) p300 HAT activity in liver of USi and SIK2i mice (n = 8 per group; data represent mean ± SEM; *P < 0.01).
Figure 3
Figure 3. p300 promotes fatty acid synthesis through the regulation of ChREBP activity by acetylation.
Effects of p300 overexpression or p300 silencing on glucose and lipid metabolism in hepatocytes incubated in the presence of insulin (100 nM) and either 5 or 25 mM glucose (G5 or G25) for 18 hours. (A) ChIP assay showing p300 and ChREBP recruitment to the L-PK promoter following treatment with glucose. Data are the average of 3 independent experiments (mean ± SEM; *P < 0.05). (B) ChoRE-luc reporter activity in HepG2 cells. Data are the average of 5 independent experiments (mean ± SEM; *P < 0.05). (C) Relative expression of genes encoding LPK and FAS measured by quantitative PCR (data represent mean ± SEM of 3 independent experiments; *P < 0.01). (D) Western blot analysis of p300 and acetylated ChREBP levels. Data are representative of 3 independent experiments. (E) Left: HepG2 cells overexpressing epitope-tagged p300 and ChREBP proteins were incubated 1 hour in the presence of [3H]acetate. FLAG-ChREBP was immunoprecipitated. An autoradiogram of 3H-acetylated-FLAG-ChREBP is shown. Data are representative of 3 independent experiments. Right: ChREBP transcriptional activity was measured in HepG2 cells overexpressing p300 and a Gal4-ChREBP fusion protein. Transcriptional activity was calculated from a ratio of luciferase to β-gal activities. Experiments were carried out in triplicate. Data represent mean ± SEM; *P < 0.01. (F) Oil red O staining of neutral lipids. Original magnification, ×200. Data are representative of 3 independent experiments. (G) TG concentrations. Data are representative of 3 independent experiments. Data represent mean ± SEM; *P < 0.01.
Figure 4
Figure 4. Acetylation of ChREBP at Lys672 increases its binding to the DNA.
(A) Top: Localization of ChREBP acetylation sites in its DNA-binding domain. Bottom: Effect of single point mutation of ChREBP acetylation sites on ChoRE-luc reporter activity in HepG2 cells overexpressing p300. (B) HepG2 cells transfected with p300 and with acetylation-deficient FLAG-ChREBP mutants. FLAG-ChREBP was immunoprecipitated, and acetylated ChREBP was detected by Western blot. (C) Acetylation levels of WT, DN, or K672R ChREBP by p300 in HepG2 cells. Mlk (Max-like protein X) is a ChREBP heteropartner required for ChREBP transcriptional activity in hepatocytes. (D) ChIP assay showing the effect of K672R mutation on ChREBP recruitment to the L-PK promoter following p300 overexpression in HepG2 cells. (E) Effect of K672R ChREBP mutant on L-PK expression in HepG2 cells overexpressing p300. (F) Acetylation levels of WT, DN, or K672R ChREBP in hepatocytes incubated with insulin and 5 or 25 mM glucose. (G) ChIP assay showing the effect of K672R mutation on ChREBP recruitment to the L-PK promoter in hepatocytes incubated with insulin and either 5 or 25 mM glucose. (H) Effect of K672R ChREBP mutant on LPK expression in hepatocytes incubated with insulin and either 5 or 25 mM glucose. (I) Effect of K672R ChREBP mutant on TG synthesis in hepatocytes incubated with insulin and either 5 or 25 mM glucose. In this figure, data are the average of 3 independent experiments (mean ± SEM; *P < 0.01).
Figure 5
Figure 5. SIK2 regulates ChREBP transactivation activity through p300 phosphorylation.
(AF) Effects of SIK2 and p300 silencing on glucose and lipid metabolism were studied in hepatocytes incubated in the presence of insulin (100 nM) and either 5 or 25 mM glucose for 18 hours. (A) Levels of p300 Ser89 phosphorylation and acetylated ChREBP. Data are representative of 3 independent experiments. (B) Relative p300 HAT activity in hepatocytes incubated with 25 mM glucose and 100 nM insulin. Data are the average of 3 independent experiments (mean ± SEM; *P < 0.05). (C) ChREBP recruitment to the ChoRE-containing region of the L-PK promoter. Data are the average of 3 independent experiments (mean ± SEM; *P < 0.05). (D and E) ChoRE-luc reporter activity and L-PK and Fas expression measured by quantitative PCR. Data are the average of 3 independent experiments (mean ± SEM; *P < 0.05). (F) Hepatic TG concentrations. Data are representative of 3 independent experiments (mean ± SEM; *P < 0.01). (GI) HepG2 cells were transfected with either WT or S89A p300 expression vector with or without SIK2. (G) ChREBP acetylation levels. The amount of total ChREBP and p300 is shown. Data are representative of 3 independent experiments. (H and I) Gal4-ChREBP transactivation and ChoRE-luc activities. Data are representative of 3 independent experiments (mean ± SEM; *P < 0.05). (J) TG content. Data are representative of 3 independent experiments (mean ± SEM; *P < 0.05).
Figure 6
Figure 6. p300 overexpression impairs lipid homeostasis and leads to hepatic steatosis.
Mice were injected with either p300 and/or SIK2 overexpressing adenovirus and studied 7 days later in the fed state. (A) p300-overexpressing mice develop hepatic steatosis as shown by increased liver size and oil red O staining of liver sections. Original magnification, ×200 (n = 6 per group). (B) Western blot analysis of p300 and SIK2 protein content, acetylated ChREBP levels, and Akt phosphorylation on Thr308 (n = 6 per group). (C) Liver relative p300 HAT activity (n = 6 per group; *P < 0.01). (D) Total liver and plasma TG levels (n = 6 per group; *P < 0.01). (E) Relative L-PK and Fas gene expression (n = 6 per group; data represent mean ± SEM; *P < 0.01). (F) Acetyl-CoA concentrations (n = 6 per group; *P < 0.01). (G) ChREBP recruitment and levels of acetylated H3K9 on the L-PK promoter measured by ChIP studies (n = 8 per group; *P < 0.05).
Figure 7
Figure 7. p300 overexpression impairs liver glucose homeostasis and leads to the development of glucose intolerance and insulin resistence.
Mice were injected with p300- and/or SIK2-overexpressing adenovirus and studied 7 days later in the fed sate. (A) Left: OGTT and ITT. Right: Postprandial blood glucose and insulin concentrations (n = 6 per group; *P < 0.01). (B) Relative Pepck and G6Pase gene expression (n = 6 per group; *P < 0.01). (C) NF-κB–luc reporter gene assay. HepG2 cells were transfected with a NF-κB–luc reporter vector and stimulated with 10 ng/ml TNF-α. Luminescence was measured 6 hours after TNF-α incubation. Data are representative of 3 independent experiments (mean ± SEM; *P < 0.05).
Figure 8
Figure 8. Model of SIK2 actions on the regulation of p300 HAT activity, linking dietary lipids, hepatosteatosis, hepatic inflammation, and glucose intolerance.

References

    1. Eckel RH, Grundy SM, Zimmet PZ. The metabolic syndrome. Lancet. 2005;365(9468):1415–1428. doi: 10.1016/S0140-6736(05)66378-7. - DOI - PubMed
    1. Ford ES, Giles WH, Mokdad AH. Increasing prevalence of the metabolic syndrome among U.S. adults. Diabetes Care. 2004;27(10):2444–2449. doi: 10.2337/diacare.27.10.2444. - DOI - PubMed
    1. Hirosumi J, et al. A central role for JNK in obesity and insulin resistance. Nature. 2002;420(6913):333–336. doi: 10.1038/nature01137. - DOI - PubMed
    1. Ozcan U, et al. Endoplasmic reticulum stress links obesity, insulin action, and type 2 diabetes. Science. 2004;306(5695):457–461. doi: 10.1126/science.1103160. - DOI - PubMed
    1. Postic C, Girard J. Contribution of de novo fatty acid synthesis to hepatic steatosis and insulin resistance: lessons from genetically engineered mice. . J Clin Invest. 2008;118(3):829–838. doi: 10.1172/JCI34275. - DOI - PMC - PubMed

Publication types

MeSH terms

Substances