. 2010 Dec 1;9(23):4688-702.
doi: 10.4161/cc.9.23.14050. Epub 2010 Dec 1.

The Mek1 phosphorylation cascade plays a role in meiotic recombination of Schizosaccharomyces pombe

Affiliations

The Mek1 phosphorylation cascade plays a role in meiotic recombination of Schizosaccharomyces pombe

Takahiro Tougan et al. Cell Cycle. .

Abstract

Mek1 is a Chk2/Rad53/Cds1-related protein kinase that is required for proper meiotic progression of Schizosaccharomyces pombe. However, the molecular mechanisms of Mek1 regulation and Mek1 phosphorylation targets are unclear. Here, we report that Mek1 is phosphorylated at serine-12 (S12), S14 and threonine-15 (T15) by Rad3 (ATR) and/or Tel1 (ATM) kinases that are activated by meiotic programmed double-strand breaks (DSBs). Mutations of these sites by alanine replacement caused abnormal meiotic progression and recombination rates. Phosphorylation of these sites triggers autophosphorylation of Mek1; indeed, alanine replacement mutations of Mek1-T318 and -T322 residues in the activation loop of Mek1 reduced Mek1 kinase activity and meiotic recombination rates. Substrates of Mek1 include Mus81-T275, Rdh54-T6 and Rdh54-T673. Mus81-T275 is known to regulate the Mus81 function in DNA cleavage, whereas Rdh54-T6A/T673A mutant cells showed abnormal meiotic recombination. Taken together, we conclude that the phosphorylation of Mek1 by Rad3 or Tel1, Mek1 autophosphorylation and Mus81 or Rdh54 phosphorylation by Mek1 regulate meiotic progression in S. pombe.


Figures
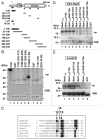
Figure 1
Figure 1
Rad3 and Tel1 phosphorylate S12, S14 and T15 in the N-terminal region of S. pombe Mek1. (A) Structure of S. pombe Mek1 (455 amino acids) with FHA and kinase domains. Asterisks indicate the locations of motifs that are commonly found around the S and T phosphorylation targets. (B, D and E) GST-Rad3 in (B and D) or Tel-GFP in (E), phosphorylates GST-Mek1 fragments, as revealed by in vitro kinase assays. Proteins were separated by SDS-PAGE, and the kinase assay substrates are indicated above each lane. Incorporation of 32P is shown in the upper part (32P), and the amount of protein assessed by Coomassie brilliant blue (CBB) staining is shown in the lower part. 32P incorporation was visualized using a phosphor image analyzer (Fuji Film, Tokyo, Japan). (C) Alignment of the N-terminal SQ/TQ cluster domains of the fission yeast Mek1 (SpMek1) and Cds1 (SpCds1), budding yeast Rad53 (ScRad53), Drosophila melanogaster Dmnk, Xenopus laevis Cds1 (XlCds1), Mus musculus Chk2 (MmChk2) and Homo sapiens Chk2 (HsChk2). Hyphens represent gaps that were inserted to maximize homology. Amino acids identical to those in Mek1 are shaded in black, while similar residues are shaded in gray.
Figure 2
Figure 2
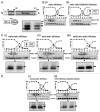
Mek1 is phosphorylated in vivo during meiosis. (A) Schematic of the truncated Mek1-100-9Myc protein fusion. Plasmids carrying the Mek1-100-9Myc fusion construct or a construct with the S12AS14AT15A mutations were integrated into the mek1 promoter locus in mek1Δ cells. (B) Detection of Mek1 bands in mek1-100-myc cells (TT623) (i) or mek1-100-S12AS14AT15A-9myc cells (TT710) (ii) during meiosis by western blot analysis. Only a single band is detected in TT710 cells, in which S12, S14 and T15 of Mek1 are replaced by alanine. (C) Detection of multiple bands of Mek1 in rad3Δ mek1-100-9myc cells (TT705) (i), tel1Δ mek1-100-9myc cells (TT286) (ii) or rad3Δ tel1Δ mek1-100-9myc cells (TT201) (iii) during meiosis. Asterisks indicate putative unphosphorylated bands, while white and black arrowheads denote putative phosphorylated bands. The intensity of the black arrowhead band is remarkably weakened in tel1Δ mek1-100-9myc cells, suggesting it to be primarily derived from phosphorylation by Tel1. (D) Detection of multiple bands of Mek1 during meiosis in rec12Δ mek1-100-9myc cells (TT266) (i) or in haploid mek1-100-9myc cells (TT608) (ii). The rec12Δ cells cannot generate double strand breaks during meiosis, while the mek1-100-9myc cells were induced to undergo haploid meiosis in the pat1 genetic background. (E) Hydroxyurea (HU) blocks DNA replication of mek1-100-9myc cells, as observed by the persistence of single-nucleus cells and by FACS analysis. (F) Detection of multiple Mek1 bands in mek1-100-9myc cells after HU treatment during meiosis.
Figure 3
Figure 3
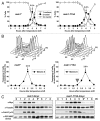
Meiotic progression is delayed in mek1-T15A-9myc pat1 cells. (A) Meiotic progression was monitored by counting nuclei following the induction of meiosis at the indicated times in mek1+ cells, mek1-9myc pat1 cells (TT305) and mek1-T15A-9myc pat1 cells (TT273). The data are the means ± SD of at least three independent experiments. (B) Progression of meiotic S phase was monitored by FACS analysis of the DNA content of samples collected at each time point (upper parts). The fraction of cells undergoing DNA replication at each time point was determined from the FACS profiles with Modfit LT software (lower parts). (C) Western blot detection of Mek1-9myc, α-Tubulin, Tyr15 phosphorylated Cdc2 and total Cdc2. Samples were taken after the temperature shift at the indicated times. α-tubulin was used as a loading control. Asterisks show the time at which the number of cells possessing two nuclei peaked.
Figure 4
Figure 4
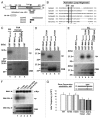
Mek1-T318 and -T322 are necessary for the full kinase activity of Mek1 and meiotic recombination. (A) Schematic diagram of S. pombe Mek1 shows the locations of the Activation Loop (AL; shaded box) and four fragments (black and gray boxes) used as substrates for the in vitro kinase assay. Black and gray colors indicate phosphorylated and non-phosphorylated fragments, respectively. Mek1 fragment amino acid numbers are shown at the left of each box. (B) Alignment of the primary structure around the conserved T318 and T322 residues (highlighted) of S. pombe (Sp) Mek1 with other related protein fragments. Asterisks or colons signify identical or almost identical amino acids among the denoted proteins. (C–E) Mek1 kinase (Mek1-9Myc immunoprecipitate) phosphorylates the Mek1 fragments indicated above each lane. Upper parts, incorporation of 32P; lower parts, the amount of loaded protein as assessed by CBB staining. Replacements of the S83, H86, T318 and T322 residues by alanine (A) are denoted. Asterisks indicate putative degradation products. (F) Detection of the kinase activity of Mek1 mutants in vitro. WT and Mek1 mutant proteins were prepared by immunoprecipitation, and their kinase activities were measured using the AL fragment as a substrate. The amount of immunoprecipitated Mek1 kinases assessed by western analysis with the anti-Myc antibody, the incorporation of 32P into the tested substrate, and the amount of loaded protein assessed by CBB staining are shown in the upper, middle and lower parts, respectively. The lower bands in the lower part are degradation products (asterisk). (G) Intragenic recombination between the ade6-M26 and ade6-469 alleles on chromosome III in WT (TT230 × TT231), mek1-T318A (TT677 × TT678), mek1-T322A (TT679 × TT680), mek1-T318AT322A (TT681 × TT682) or mek1-D218A (TT591 × TT592) strains. The positions of the ade6+ locus and centromeres (gray balls) on chromosome III are illustrated in the inset. The data show the averages and standard deviation of triplicate experiments.
Figure 5
Figure 5
Mek1 and/or Cds1 phosphorylate the T218, T275 and/or T422 residues of S. pombe Mus81 in vitro. (A) Schematic diagram of GST-Mus81 fragments. Mus81 fragment amino acid numbers are shown left of each box. (B ∼ E) refers to fragments whose in vitro kinase assay data are shown below in (B ∼ E). Black and gray boxes indicate phosphorylated and non-phosphorylated fragments, respectively. Sub1 (substrate 1) and Sub2 (substrate 2) signify the GST-Mus81 fragments that were used for the kinase assay in (B). (B–F) SDS-PAGE parts for in vitro kinase reactions performed with truncated GST-Mus81 fragments and Mek1-GFP (i) or Cds1-2HA (ii) as kinases. Simply Blue staining (SB, left parts, C–F) shows a loading control. (B) The truncated GST-fusion proteins used were those containing Sub1 and Sub2, and derivatives with replacement of the T218 and T422 residues by alanine (A). (C) The truncated GST-fusion proteins used were those containing amino acids 1–127, 32–217, 219–421 and 423–608 of Mus81. An asterisk shows the autophosphorylated band of Mek1 kinase. (D) The truncated GST-fusion proteins used were those containing amino acids 219–421, 219–281, 252–362 and 336–421 of Mus81. (E) The truncated GST-fusion proteins used were those containing amino acids 252–362, 252–313, 287–362 and 317–362 of Mus81. (F) The truncated GST-fusion proteins used were those containing amino acids 252–281 and 276–313 of Mus81, and derivatives with replacement of T260, S270 and T275 residues by (A). GST-252-281 (3A) signifies that this GST-Mus81 fragment harbors all of these replacements.
Figure 6
Figure 6
Mek1 phosphorylates Rdh54 on T6 and T673. (A) Schematic presentation of the RXXT site and the fragment map of Rdh54 and Rhp54 derivatives that are expressed as N-terminal GST-fused proteins. (B) Left part, Mek1 kinase assay performed in vitro with Mek1-GFP immunoprecipitates from mitotic S. pombe cells and the GST-fused Rdh54 and Rhp54 fragments, and Mcp6 and Meu13 proteins as substrates. Right part, Simply Blue staining of an SDS-PA gel shows a loading control. (C) Mek1 kinase assay performed in vitro with GST-fusion Rdh54 truncated proteins with/without point mutations, in which T6, T158 and/or T673 were replaced with alanine. (D) Mek1 kinase assay performed in vitro with immunoprecipitates of Mek1-GFP (positive control), Mek1-KD-GFP (kinase-dead form) or GFP (negative control), and truncated GST-fused Rdh54-1 or Rdh54-5/6 fragments or GST alone as substrates. The arrow indicates autophosphorylation of Mek1. (E) Western blot analysis conducted during S. pombe meiosis using an anti-Rdh54-pT6 antibody in the absence (i) or presence (ii) of a phosphopeptide (KRRApTFQCPLIEC) that was used as an antigen. The h/h pat1-114 mug28+-3HA strain was induced to enter meiosis synchronously by a temperature shift, and cells were collected at 1 h intervals for protein extraction, blotting and probing with the anti-Rdh54-pT6 antibody. Tilted arrowheads in (i) indicate putative Rdh54-pT6 bands that disappeared after a competition experiment, in which the phosphopeptide was incubated with the antibody before probing the western blot, as indicated by tilted arrows in (ii). Asterisks indicate putative nonspecific bands that were not weakened after peptide competition. Meiotic expression of Meu13 was analyzed to identify the meiotic stage at each time point. Cdc2 and α-tubulin levels were examined as loading controls. (F) Dot blot analysis indicates that the anti-Rdh54-pT6 antibody recognized the phosphopeptide that was used as an antigen, but not the non-phosphopeptide (KRRATFQCPLIEC). (G) Gene conversion rates involving ade6-M26 and ade6-469 on chromosome III were measured in rdh54 point mutants. The bar graph with error bars shows the average ± SD values of three independent experiments. (H) Observation of Rdh54 nuclear foci in rdh54 mutant cells and the mek1Δ strain. The rdh54-WT (TK118-WTG), rdh54-T6A (TK118-T6A-1), rdh54-T6A/T673A (TK201-1), rdh54-K241R (TK119-K241R-1), rdh54-T6A/K241R (TK118-T6A/K241R-1) and mek1Δ (TK123) cells induced to enter meiosis were analyzed by fluorescence microscopy for Rdh54-GFP (green). Typical images are shown in the upper parts. Scale bar: 10 µm. The bar graph shows the frequency of cells with 0, 1–3, 4–7 or 8–12 Rdh54-GFP foci at the horsetail phase.
Figure 6
Figure 6
Mek1 phosphorylates Rdh54 on T6 and T673. (A) Schematic presentation of the RXXT site and the fragment map of Rdh54 and Rhp54 derivatives that are expressed as N-terminal GST-fused proteins. (B) Left part, Mek1 kinase assay performed in vitro with Mek1-GFP immunoprecipitates from mitotic S. pombe cells and the GST-fused Rdh54 and Rhp54 fragments, and Mcp6 and Meu13 proteins as substrates. Right part, Simply Blue staining of an SDS-PA gel shows a loading control. (C) Mek1 kinase assay performed in vitro with GST-fusion Rdh54 truncated proteins with/without point mutations, in which T6, T158 and/or T673 were replaced with alanine. (D) Mek1 kinase assay performed in vitro with immunoprecipitates of Mek1-GFP (positive control), Mek1-KD-GFP (kinase-dead form) or GFP (negative control), and truncated GST-fused Rdh54-1 or Rdh54-5/6 fragments or GST alone as substrates. The arrow indicates autophosphorylation of Mek1. (E) Western blot analysis conducted during S. pombe meiosis using an anti-Rdh54-pT6 antibody in the absence (i) or presence (ii) of a phosphopeptide (KRRApTFQCPLIEC) that was used as an antigen. The h/h pat1-114 mug28+-3HA strain was induced to enter meiosis synchronously by a temperature shift, and cells were collected at 1 h intervals for protein extraction, blotting and probing with the anti-Rdh54-pT6 antibody. Tilted arrowheads in (i) indicate putative Rdh54-pT6 bands that disappeared after a competition experiment, in which the phosphopeptide was incubated with the antibody before probing the western blot, as indicated by tilted arrows in (ii). Asterisks indicate putative nonspecific bands that were not weakened after peptide competition. Meiotic expression of Meu13 was analyzed to identify the meiotic stage at each time point. Cdc2 and α-tubulin levels were examined as loading controls. (F) Dot blot analysis indicates that the anti-Rdh54-pT6 antibody recognized the phosphopeptide that was used as an antigen, but not the non-phosphopeptide (KRRATFQCPLIEC). (G) Gene conversion rates involving ade6-M26 and ade6-469 on chromosome III were measured in rdh54 point mutants. The bar graph with error bars shows the average ± SD values of three independent experiments. (H) Observation of Rdh54 nuclear foci in rdh54 mutant cells and the mek1Δ strain. The rdh54-WT (TK118-WTG), rdh54-T6A (TK118-T6A-1), rdh54-T6A/T673A (TK201-1), rdh54-K241R (TK119-K241R-1), rdh54-T6A/K241R (TK118-T6A/K241R-1) and mek1Δ (TK123) cells induced to enter meiosis were analyzed by fluorescence microscopy for Rdh54-GFP (green). Typical images are shown in the upper parts. Scale bar: 10 µm. The bar graph shows the frequency of cells with 0, 1–3, 4–7 or 8–12 Rdh54-GFP foci at the horsetail phase.

Similar articles

Cited by

References

    1. Ciccia A, McDonald N, West SC. Structural and Functional Relationships of the XPF/MUS81 Family of Proteins. Annu Rev Biochem. 2008;77:259–287. - PubMed
    1. Smith GR. Genetic analysis of meiotic recombination in Schizosaccharomyces pombe. Methods Mol Biol. 2009;557:65–76. - PMC - PubMed
    1. Huertas P. DNA resection in eukaryotes: Deciding how to fix the break. Nat Struct Mol Biol. 2010;17:11–16. - PMC - PubMed
    1. Niu H, Wan L, Baumgartner B, Schaefer D, Loidl J, Hollingsworth NM. Partner choice during meiosis is regulated by Hop1-promoted dimerization of Mek1. Mol Biol Cell. 2005;16:5804–5818. - PMC - PubMed
    1. Cartagena-Lirola H, Guerini I, Manfrini N, Lucchini G, Longhese MP. Roles of the S. cerevisiae Rad53 checkpoint kinase in signalling double-strand breaks during the meiotic cell cycle. Mol Cell Biol. 2008;28:4480–4493. - PMC - PubMed

Publication types

MeSH terms