. 2011 Jan 1;11(1):32-9.
doi: 10.4161/cbt.11.1.13835. Epub 2011 Jan 1.

Astrocyte-elevated gene-1 (AEG-1) induction by hypoxia and glucose deprivation in glioblastoma

Affiliations

Astrocyte-elevated gene-1 (AEG-1) induction by hypoxia and glucose deprivation in glioblastoma

Evan Noch et al. Cancer Biol Ther. .

Abstract

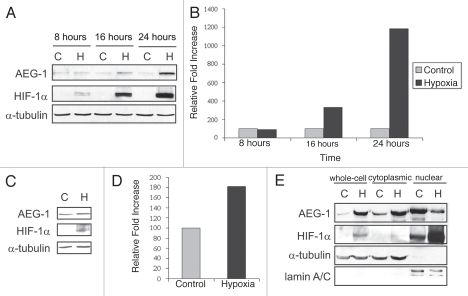
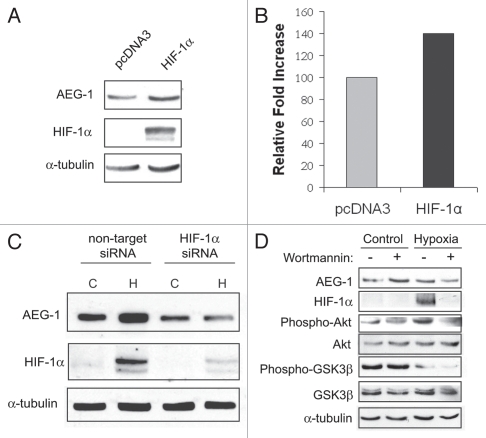
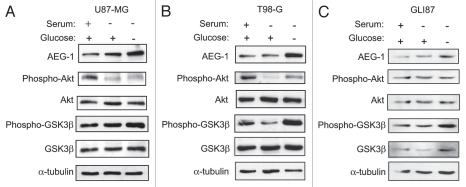
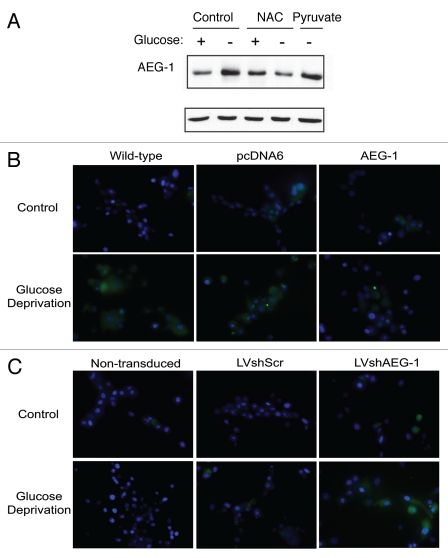
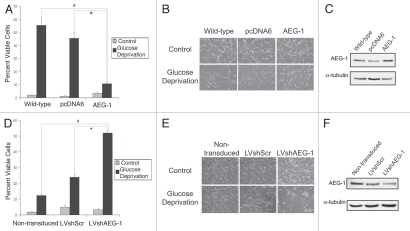
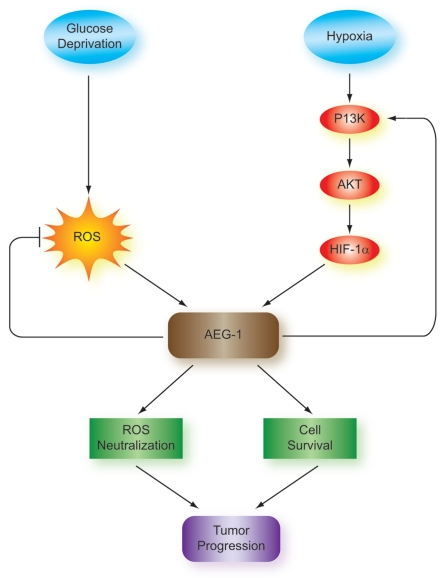
Glioblastomas continue to carry poor prognoses for patients despite advances in surgical, chemotherapeutic, and radiation regimens. One feature of glioblastoma associated with poor prognosis is the degree of hypoxia and expression levels of hypoxia-inducible factor-1 α (HIF-1α). HIF-1α expression allows metabolic adaptation to low oxygen availability, partly through upregulation of VEGF and increased tumor angiogenesis. Here, we demonstrate an induced level of astrocyte-elevated gene-1 (AEG-1) by hypoxia in glioblastoma cells. AEG-1 has the capacity to promote anchorage-independent growth and cooperates with Ha-ras in malignant transformation. In addition, AEG-1 was recently demonstrated to serve as an oncogene and can induce angiogenesis in glioblastoma. Results from in vitro studies show that hypoxic induction of AEG-1 is dependent on HIF-1α stabilization during hypoxia and that PI3K inhibition abrogates AEG-1 induction during hypoxia through loss of HIF-1α stability. Furthermore, we show that AEG-1 is induced by glucose deprivation and that prevention of intracellular reactive oxygen species (ROS) production prevents this induction. Additionally, AEG-1 knockdown results in increased ROS production and increased glucose deprivation-induced cytotoxicity. On the other hand, AEG-1 overexpression prevents ROS production and decreases glucose deprivation-induced cytotoxicity, indicating that AEG-1 induction is necessary for cells to survive this type of cell stress. These observations link AEG-1 overexpression in glioblastoma with hypoxia and glucose deprivation, and targeting these physiological pathways may lead to therapeutic advances in the treatment of glioblastoma in the future.


Figures

Figure 1
Figure 1
Hypoxia induces AEG-1 expression in vitro. (A) AEG-1 expression during 24-hour time-course of hypoxia in vitro. U87MG cells were exposed to 8, 16 or 24 hours of hypoxia or normoxia. Hypoxia was achieved by placing cells in a sealed chamber and then flushing the chamber with a mixture of 95% N2, 5% CO2 mixture for 15 minutes. Cells were then placed in 37°C for the indicated time-points, after which whole-cell extracts were collected. HIF-1α staining was used to ensure that hypoxia was achieved. (B) Quantification of hypoxic induction of AEG-1. (C) The primary, non-established mixed glioblastoma cell culture, GLI87, was exposed to hypoxia or normoxia for 24 hours, and the expression of AEG-1 was assessed. (D) Quantification of hypoxic induction of AEG-1 in GLI87 cells. (E) Analysis of the sub-cellular localization of AEG-1 during hypoxia. U87MG cells were treated with hypoxia or normoxia as before, and whole-cell, cytoplasmic and nuclear extracts were collected. Lamin A/C expression was used to confirm nuclear extract purity.
Figure 2
Figure 2
HIF-1α is necessary but not sufficient for AEG-1 induction during hypoxia. (A) U87-MG cells were transfected with HIF-1α or empty vector for 24 hours, and the expression of AEG-1 was analyzed by western blot. (B) U87-MG cells were transfected with either non-target siRNA or HIF-1α siRNA and after 24 hours were placed in normoxia (C) or hypoxia (H) for an additional 24 hours. (C) U87-MG cells were incubated with the PI3K inhibitor, wortmannin (25 uM), just before 24 hour hypoxia or normoxia. AEG-1 expression as well as the phosphorylated and total levels of Akt and GSK3β were evaluated. HIF-1α expression was used to monitor hypoxic induction.
Figure 3
Figure 3
AEG-1 is induced by glucose deprivation in glioblastoma cells. (A) U87-MG cells, (B) T98-G cells and (C) GLI87 cells were treated with DMEM containing 1 g/L glucose and 10% FBS or no FBS or DMEM without FBS and without glucose for 8 hours. AEG-1 expression was assessed in each cell line as well as the phosphorylated and total amounts of the members of the PI3K signaling pathway, Akt and GSK3β.
Figure 4
Figure 4
AEG-1 upregulation during glucose deprivation is dependent on reactive oxygen species production. (A) U87-MG cells were incubated with 24 mM N-acetylcysteine (NAC), 1 mM pyruvate or were untreated and then exposed to glucose deprivation or control medium for 8 hours. The expression of AEG-1 was assessed in whole-cell extracts. (B) Wild-type U87-MG cells or U87-MG cells stably expressing AEG-1 or empty vector were exposed to glucose deprivation or control medium for 16 hours and ROS production was measured using the fluorescent dye, 25 µM carboxy-H2-DCFDA. Hoechst staining was also performed to label nuclei. (C) Non-transduced, lentiviral scrambled shRNA (LVshScr)-transduced or lentiviral AEG-1 shRNA (LVshAEG-1)-transduced U87-MG cells were exposed to 9 hours of glucose deprivation, and ROS production was measured as in (B).
Figure 5
Figure 5
AEG-1 overexpression prevents glucose deprivation-induced cytotoxicity. (A) Wild-type U87-MG cells or U87-MG cells stably expressing either AEG-1 or empty vector were exposed to glucose deprivation for 16 hours and were then counted by trypan blue exclusion assay. The total number of cells as well as the number of non-viable cells were counted in each field. Four hundred cells were counted in three separate fields per plate, and each experiment was conducted in triplicate. Values are presented as the number of viable cells divided by the total number of cells for each field. Asterisks indicate statistically significant differences where indicated (p < 0.05). (B) Phase-contrast images of wild-type, empty vector-expressing and AEG-1-expressing U87-MG cells exposed to glucose deprivation in (A). (C) Western blot for AEG-1 expression in wild-type, empty vector-expressing and AEG-1-expressing U87-MG cells. (D) Non-transduced U87-MG cells or U87-MG cells stably expressing either lentiviral scrambled shRNA (LVshScr) or lentiviral AEG-1 shRNA (LVshAEG-1) were exposed to glucose deprivation for 10 hours and were then counted by trypan blue exclusion assay as in (A). (E) Phase-contrast images of non-transduced, LVshScr-transduced and LVshAEG-1-transduced U87-MG cells exposed to glucose deprivation in (D). (F) Western blot of AEG-1 expression in non-transduced, LVshScr-transduced and LV-shAEG-1-transduced U87-MG cells.
Figure 6
Figure 6
Mechanism and significance of AEG-1 induction by hypoxia and glucose deprivation in glioblastoma. Glucose deprivation and hypoxia lead to AEG-1 induction in glioblastoma. AEG-1 induction by glucose deprivation depends on the formation of reactive oxygen species (ROS), which are formed during periods of low supplies of NADPH, the reduced form of nicotinamide adenine dinucleotide phosphate (NADP+). Hypoxic induction of AEG-1 acts through the PI3K/Akt pathway to stabilize HIF-1α and AEG-1 feeds back to activate PI3K and create a positive feedback loop. The result of AEG-1 induction is enhanced cell survival during periods of glucose deprivation as well as prevention of ROS induction, which contribute to tumor progression and poor prognosis in glioblastoma.

Comment in

Similar articles

Cited by

References

    1. Oliver L, Olivier C, Marhuenda FB, Campone M, Vallette FM. Hypoxia and the malignant glioma microenvironment: regulation and implications for therapy. Curr Mol Pharmacol. 2009;2:263–284. - PubMed
    1. Yang C, Sudderth J, Dang T, Bachoo RM, McDonald JG, DeBerardinis RJ. Glioblastoma cells require glutamate dehydrogenase to survive impairments of glucose metabolism or Akt signaling. Cancer Res. 2009;69:7986–7993. - PMC - PubMed
    1. Kang DC, Su ZZ, Sarkar D, Emdad L, Volsky DJ, Fisher PB. Cloning and characterization of HIV-1-inducible astrocyte elevated gene-1, AEG-1. Gene. 2005;353:8–15. - PubMed
    1. Emdad L, Lee SG, Su ZZ, Jeon HY, Boukerche H, Sarkar D, et al. Astrocyte elevated gene-1 (AEG-1) functions as an oncogene and regulates angiogenesis. Proc Natl Acad Sci USA. 2009;106:21300–21305. - PMC - PubMed
    1. Yu C, Chen K, Zheng H, Guo X, Jia W, Li M, et al. Overexpression of astrocyte elevated gene-1 (AEG-1) is associated with esophageal squamous cell carcinoma (ESCC) progression and pathogenesis. Carcinogenesis. 2009;30:894–901. - PubMed

Publication types

MeSH terms