

Data quality control in genetic case-control association studies
- PMID: 21085122
- PMCID: PMC3025522
- DOI: 10.1038/nprot.2010.116
Data quality control in genetic case-control association studies
Abstract
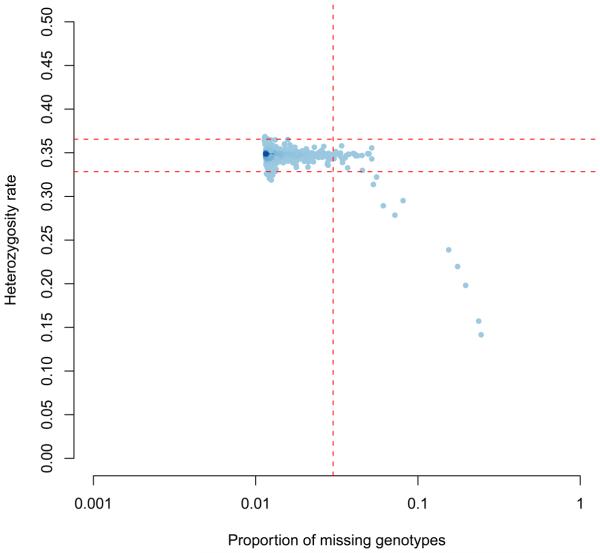
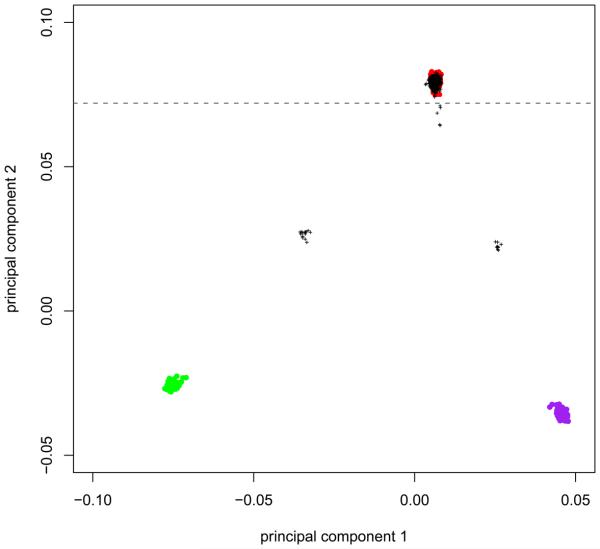
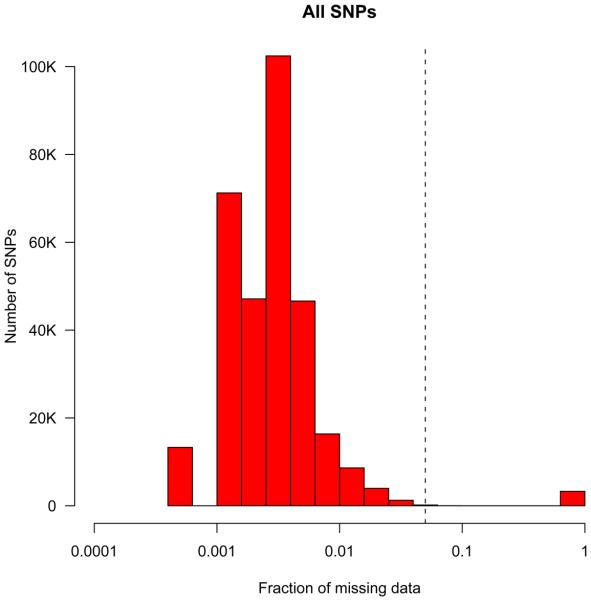
This protocol details the steps for data quality assessment and control that are typically carried out during case-control association studies. The steps described involve the identification and removal of DNA samples and markers that introduce bias. These critical steps are paramount to the success of a case-control study and are necessary before statistically testing for association. We describe how to use PLINK, a tool for handling SNP data, to perform assessments of failure rate per individual and per SNP and to assess the degree of relatedness between individuals. We also detail other quality-control procedures, including the use of SMARTPCA software for the identification of ancestral outliers. These platforms were selected because they are user-friendly, widely used and computationally efficient. Steps needed to detect and establish a disease association using case-control data are not discussed here. Issues concerning study design and marker selection in case-control studies have been discussed in our earlier protocols. This protocol, which is routinely used in our labs, should take approximately 8 h to complete.
Figures
References
-
- Clayton DG, et al. Population structure, differential bias and genomic control in a large-scale, case-control association study. Nat Genet. 2005;37:1243. - PubMed
-
- Marchini J, Howie B, Myers SR, McVean G, Donnelly P. A new multipoint method for genome-wide association studies by imputation of genotypes. Nat Genet. 2007;39:906. - PubMed
Publication types
MeSH terms
Grants and funding
LinkOut - more resources
Full Text Sources
Other Literature Sources
Molecular Biology Databases
