

L1 retrotransposition in neurons is modulated by MeCP2
- PMID: 21085180
- PMCID: PMC3059197
- DOI: 10.1038/nature09544
L1 retrotransposition in neurons is modulated by MeCP2
Abstract
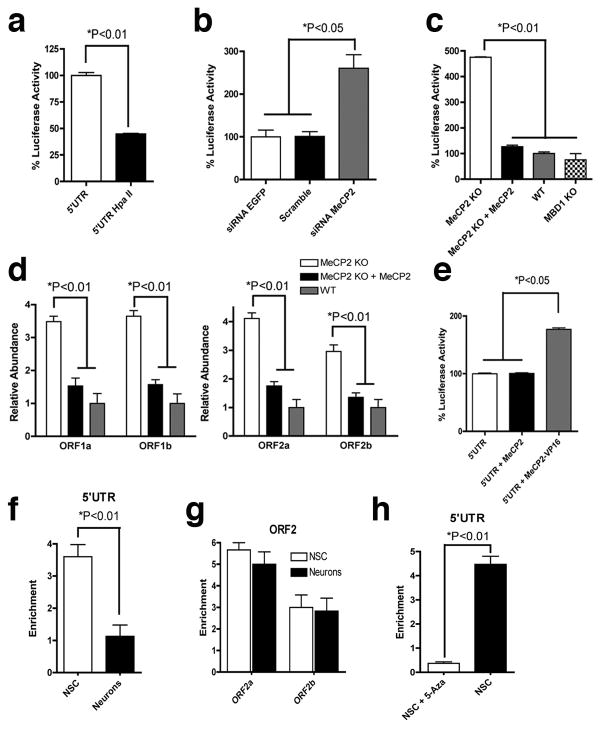
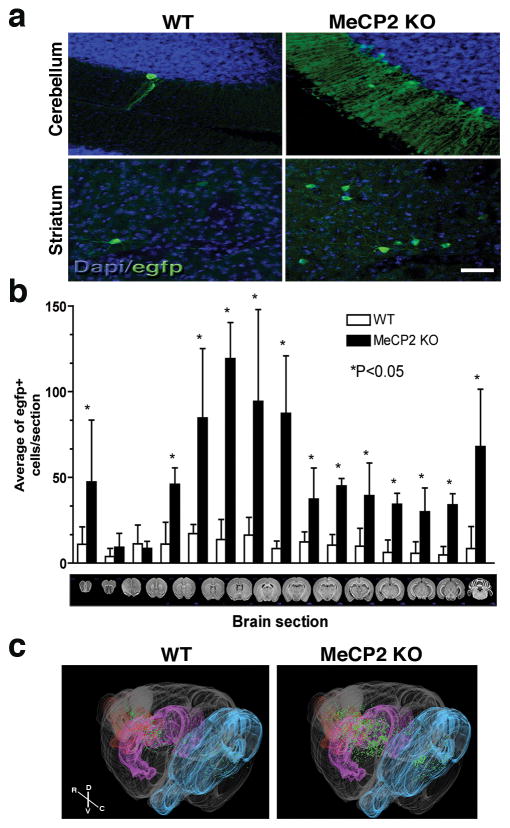
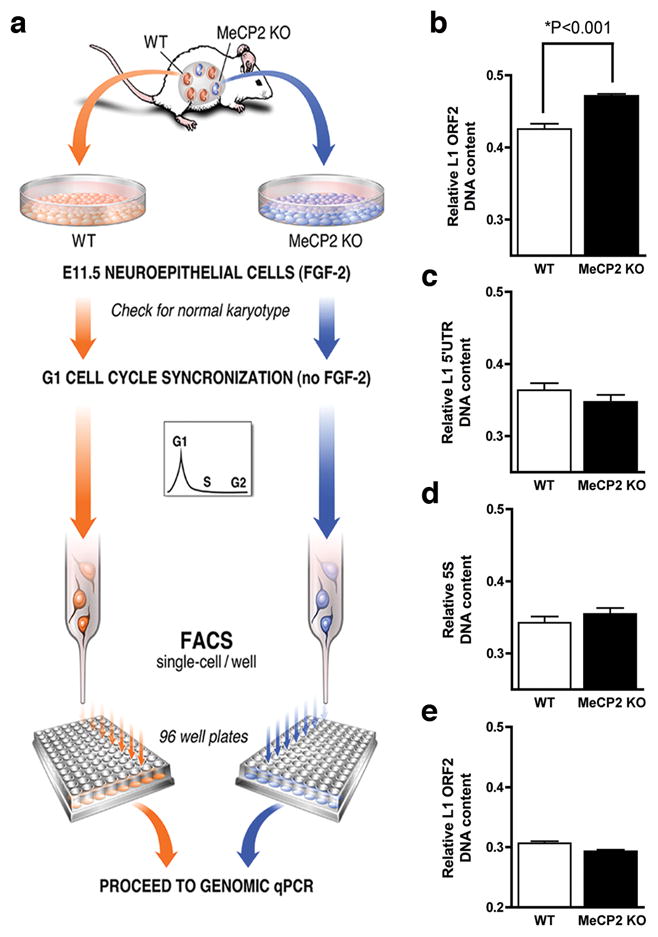
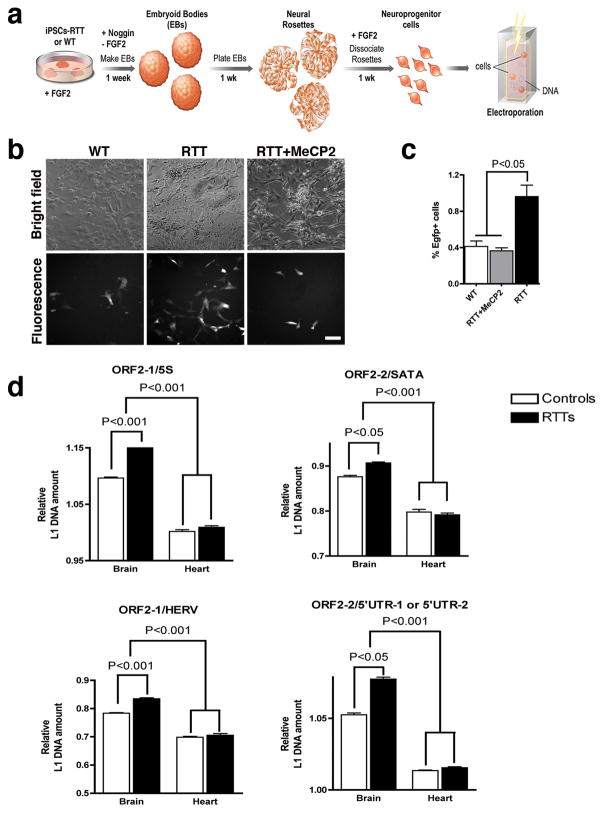
Long interspersed nuclear elements-1 (LINE-1 or L1s) are abundant retrotransposons that comprise approximately 20% of mammalian genomes. Active L1 retrotransposons can impact the genome in a variety of ways, creating insertions, deletions, new splice sites or gene expression fine-tuning. We have shown previously that L1 retrotransposons are capable of mobilization in neuronal progenitor cells from rodents and humans and evidence of massive L1 insertions was observed in adult brain tissues but not in other somatic tissues. In addition, L1 mobility in the adult hippocampus can be influenced by the environment. The neuronal specificity of somatic L1 retrotransposition in neural progenitors is partially due to the transition of a Sox2/HDAC1 repressor complex to a Wnt-mediated T-cell factor/lymphoid enhancer factor (TCF/LEF) transcriptional activator. The transcriptional switch accompanies chromatin remodelling during neuronal differentiation, allowing a transient stimulation of L1 transcription. The activity of L1 retrotransposons during brain development can have an impact on gene expression and neuronal function, thereby increasing brain-specific genetic mosaicism. Further understanding of the molecular mechanisms that regulate L1 expression should provide new insights into the role of L1 retrotransposition during brain development. Here we show that L1 neuronal transcription and retrotransposition in rodents are increased in the absence of methyl-CpG-binding protein 2 (MeCP2), a protein involved in global DNA methylation and human neurodevelopmental diseases. Using neuronal progenitor cells derived from human induced pluripotent stem cells and human tissues, we revealed that patients with Rett syndrome (RTT), carrying MeCP2 mutations, have increased susceptibility for L1 retrotransposition. Our data demonstrate that L1 retrotransposition can be controlled in a tissue-specific manner and that disease-related genetic mutations can influence the frequency of neuronal L1 retrotransposition. Our findings add a new level of complexity to the molecular events that can lead to neurological disorders.
Conflict of interest statement
The authors declare that they have no competing financial interests.
Figures
Comment in
-
Neuroscience: Excessive mobility interrupted.Nature. 2010 Nov 18;468(7322):383-4. doi: 10.1038/468383a. Nature. 2010. PMID: 21085168 No abstract available.
References
-
- Lander ES, et al. Initial sequencing and analysis of the human genome. Nature. 2001;409 (6822):860–921. - PubMed
-
- Gibbs RA, et al. Genome sequence of the Brown Norway rat yields insights into mammalian evolution. Nature. 2004;428 (6982):493–521. - PubMed
-
- Waterston RH, et al. Initial sequencing and comparative analysis of the mouse genome. Nature. 2002;420 (6915):520–562. - PubMed
-
- Kazazian HH., Jr Mobile elements and disease. Curr Opin Genet Dev. 1998;8 (3):343–350. - PubMed
-
- Han JS, Szak ST, Boeke JD. Transcriptional disruption by the L1 retrotransposon and implications for mammalian transcriptomes. Nature. 2004;429 (6989):268–274. - PubMed
Publication types
MeSH terms
Substances
Grants and funding
LinkOut - more resources
Full Text Sources
Other Literature Sources
Molecular Biology Databases
Miscellaneous
