

A comprehensive genetic analysis of candidate genes regulating response to Trypanosoma congolense infection in mice
- PMID: 21085469
- PMCID: PMC2976683
- DOI: 10.1371/journal.pntd.0000880
A comprehensive genetic analysis of candidate genes regulating response to Trypanosoma congolense infection in mice
Abstract
Background: African trypanosomes are protozoan parasites that cause "sleeping sickness" in humans and a similar disease in livestock. Trypanosomes also infect laboratory mice and three major quantitative trait loci (QTL) that regulate survival time after infection with T. congolense have been identified in two independent crosses between susceptible A/J and BALB/c mice, and the resistant C57BL/6. These were designated Tir1, Tir2 and Tir3 for Trypanosoma infection response, and range in size from 0.9-12 cM.
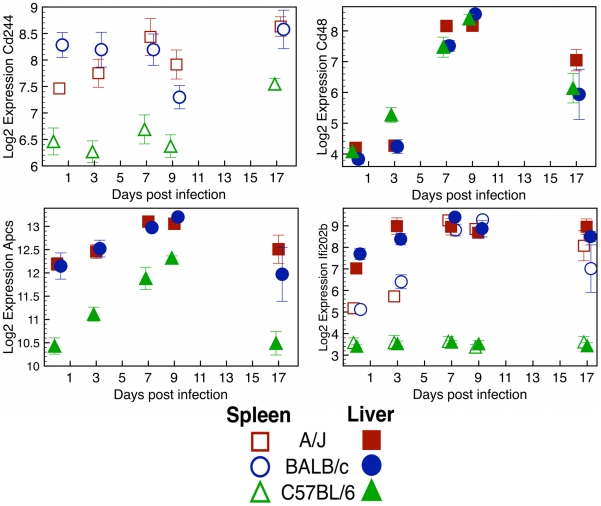
Principal findings: Mapping loci regulating survival time after T. congolense infection in an additional cross revealed that susceptible C3H/HeJ mice have alleles that reduce survival time after infection at Tir1 and Tir3 QTL, but not at Tir2. Next-generation resequencing of a 6.2 Mbp region of mouse chromosome 17, which includes Tir1, identified 1,632 common single nucleotide polymorphisms (SNP) including a probably damaging non-synonymous SNP in Pram1 (PML-RAR alpha-regulated adaptor molecule 1), which was the most plausible candidate QTL gene in Tir1. Genome-wide comparative genomic hybridisation identified 12 loci with copy number variants (CNV) that correlate with differential gene expression, including Cd244 (natural killer cell receptor 2B4), which lies close to the peak of Tir3c and has gene expression that correlates with CNV and phenotype, making it a strong candidate QTL gene at this locus.
Conclusions: By systematically combining next-generation DNA capture and sequencing, array-based comparative genomic hybridisation (aCGH), gene expression data and SNP annotation we have developed a strategy that can generate a short list of polymorphisms in candidate QTL genes that can be functionally tested.
Conflict of interest statement
The authors have declared that no competing interests exist.
Figures


Similar articles
-
High resolution mapping of trypanosomosis resistance loci Tir2 and Tir3 using F12 advanced intercross lines with major locus Tir1 fixed for the susceptible allele.BMC Genomics. 2010 Jun 22;11:394. doi: 10.1186/1471-2164-11-394. BMC Genomics. 2010. PMID: 20569426 Free PMC article.
-
Evidence for genomic imprinting of the major QTL controlling susceptibility to trypanosomiasis in mice.Parasite Immunol. 2000 May;22(5):259-63. doi: 10.1046/j.1365-3024.2000.00308.x. Parasite Immunol. 2000. PMID: 10792765
-
Clinical chemistry of congenic mice with quantitative trait loci for predicted responses to Trypanosoma congolense infection.Infect Immun. 2009 Sep;77(9):3948-57. doi: 10.1128/IAI.00658-09. Epub 2009 Jul 13. Infect Immun. 2009. PMID: 19596769 Free PMC article.
-
Susceptibility and resistance to Trypanosoma congolense infections.Microbes Infect. 2000 Nov;2(13):1619-29. doi: 10.1016/s1286-4579(00)01318-6. Microbes Infect. 2000. PMID: 11113381 Review.
-
Alternative versus classical macrophage activation during experimental African trypanosomosis.Int J Parasitol. 2001 May 1;31(5-6):575-87. doi: 10.1016/s0020-7519(01)00170-9. Int J Parasitol. 2001. PMID: 11334945 Review.
Cited by
-
Elimination of Reference Mapping Bias Reveals Robust Immune Related Allele-Specific Expression in Crossbred Sheep.Front Genet. 2019 Sep 19;10:863. doi: 10.3389/fgene.2019.00863. eCollection 2019. Front Genet. 2019. PMID: 31608110 Free PMC article.
-
Genetic control of resistance to Trypanosoma brucei brucei infection in mice.PLoS Negl Trop Dis. 2011 Jun;5(6):e1173. doi: 10.1371/journal.pntd.0001173. Epub 2011 Jun 7. PLoS Negl Trop Dis. 2011. PMID: 21666791 Free PMC article.
-
Genetic and expression analysis of cattle identifies candidate genes in pathways responding to Trypanosoma congolense infection.Proc Natl Acad Sci U S A. 2011 May 31;108(22):9304-9. doi: 10.1073/pnas.1013486108. Epub 2011 May 18. Proc Natl Acad Sci U S A. 2011. PMID: 21593421 Free PMC article.
-
The QTL within the H2 Complex Involved in the Control of Tuberculosis Infection in Mice Is the Classical Class II H2-Ab1 Gene.PLoS Genet. 2015 Nov 30;11(11):e1005672. doi: 10.1371/journal.pgen.1005672. eCollection 2015 Nov. PLoS Genet. 2015. PMID: 26618355 Free PMC article.
-
Multigenic control and sex bias in host susceptibility to spore-induced pulmonary anthrax in mice.Infect Immun. 2011 Aug;79(8):3204-15. doi: 10.1128/IAI.01389-10. Epub 2011 May 31. Infect Immun. 2011. PMID: 21628518 Free PMC article.
References
-
- Kristjanson P, Swallow B, Rowlands G, Kruska R, de Leeuw P. Measuring the costs of African animal trypanosomosis, the potential benefits of control and returns to research. Agricultural Systems. 1999:1–20.
-
- Morrison W, Murray M. Trypanosoma congolense: inheritance of susceptibility to infection in inbred strains of mice. Experimental Parasitology. 1979;48:364–374. - PubMed
-
- Murray M, Morrison WI, Whitelaw DD. Host susceptibility to African trypanosomiasis: trypanotolerance. Adv Parasitol. 1982;21:1–68. - PubMed
Publication types
MeSH terms
Substances
Grants and funding
LinkOut - more resources
Full Text Sources
Molecular Biology Databases
Miscellaneous
