. 2010 Nov 9;5(11):e13720.
doi: 10.1371/journal.pone.0013720.

Interaction of the retinoblastoma protein with Orc1 and its recruitment to human origins of DNA replication

Affiliations

Interaction of the retinoblastoma protein with Orc1 and its recruitment to human origins of DNA replication

Ramiro Mendoza-Maldonado et al. PLoS One. .

Abstract

Background: The retinoblastoma protein (Rb) is a crucial regulator of cell cycle progression by binding with E2F transcription factor and repressing the expression of a variety of genes required for the G1-S phase transition.

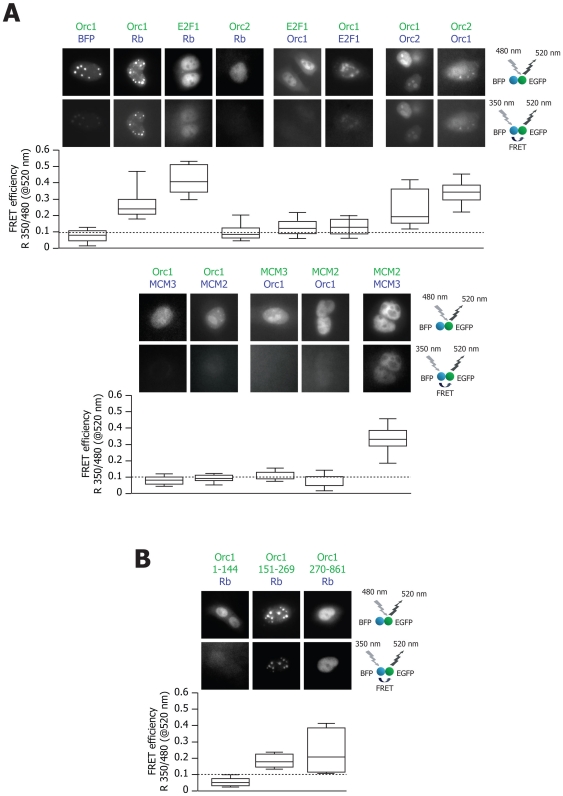
Methodology/principal findings: Here we show that Rb and E2F1 directly participate in the control of initiation of DNA replication in human HeLa, U2OS and T98G cells by specifically binding to origins of DNA replication in a cell cycle regulated manner. We show that, both in vitro and inside the cells, the largest subunit of the origin recognition complex (Orc1) specifically binds hypo-phosphorylated Rb and that this interaction is competitive with the binding of Rb to E2F1. The displacement of Rb-bound Orc1 by E2F1 at origins of DNA replication marks the progression of the G1 phase of the cell cycle toward the G1-S border.

Conclusions/significance: The participation of Rb and E2F1 in the formation of the multiprotein complex that binds origins of DNA replication in mammalian cells appears to represent an effective mechanism to couple the expression of genes required for cell cycle progression to the activation of DNA replication.


Conflict of interest statement

Competing Interests: The authors have declared that no competing interests exist.

Figures

Figure 1
Figure 1. Rb and E2F1 proteins are recruited to human origins of DNA replication.
The schemes (A) and (C) show the genomic regions containing the Lamin B2 origin and the two GM-CSF origins, respectively. Converging arrows indicate sets of primers. The histograms (B) and (D) show the quantification of crosslinked DNA immunoprecipitated by ChIP on the Lamin B2 and GM-CSF origins, respectively. Each graph shows the specific amplified genomic regions from the origins and the antibodies used for ChiP experiments. The bars indicated as Control show the results obtained by using an irrelevant antibody (normal rabbit IgG). The histograms report the results (mean and standard error of the mean, indicated by error bars) of at least three different experiments. The results are presented as a percentage of the amounts of precipitated chromatin over input DNA. For each of the investigated antibodies, but not for the control, the abundance of the immunoprecipitated regions investigated showed statistically significant difference between origin and non-origin regions (B48 and B48bis for Lamin B2 Ori and #16, #17 and #23 for the GM-CSF oris; P<0.05).
Figure 2
Figure 2. Orc1 specifically interacts with Rb in vitro.
(A) GST pull-down experiment performed by incubating GST alone or GST fused to the N-terminus (aa. 1–400) or the C-terminus (aa. 379–928) of Rb, immobilized on gluthatione-agarose beads, with in vitro translated [35S]-labelled Orc1 or Orc2 proteins. The upper panel shows the quantification of the [35S]-labelled protein after in vitro binding. The amount of radioactivity bound to the beads is indicated as a percentage of the input material. The lower panel shows the autoradiography. The Input lanes contain the labelled proteins prior to binding. A representative experiment of at least 3 performed is shown. (B) GST pull-down experiment performed by incubating GST, GST-Rb (379–928) or GST-E2F1 fusion proteins on gluthatione-agarose beads with in vitro translated [35S]-labelled Orc1 or Orc2. The results are shown as in panel (A). (C) Binding to Orc1 is specific for Rb. The scheme on the left side shows the conserved A/B pocket domains in the three members of the RB family, which were used as GST fusion proteins. The figure on the right side, shows the result of a GST pull-down experiment performed with these proteins, and in vitro translated Orc1 and Orc2. “Rb” for short corresponds to the C-terminus of Rb (aa. 379–928). (D) Binding to Orc1 requires the C-terminal region of Rb. The scheme on the left side of the figure shows the Rb truncated or mutated proteins used for mapping the domains required for binding to Orc1 (AE, containing the A, B and C pockets; AB, A and B pockets only; SE, C pocket only; AE Cys706Phe, which does not bind LxCxE proteins). These proteins were obtained as GST fusions and used for the GST pull-down experiment shown on the right side of the panel. (E) Schematic representation of the main functional domains of the Orc1 protein. BAH, bromo-adjacent homology domain; HP1, HP1 binding domain; AAA, ATPase domain; HW, putative DNA binding site. The fragments of Orc1 subsequently tested by in vitro GST pull-down are indicated by the corresponding amino acids on the left side. (F) GST pull-down experiment performed with the Orc1 fragments indicated in (E), labelled by in vitro translation, and challenged to GST or GST-Rb proteins. “Rb” for short corresponds to the C-terminus of Rb (aa. 379–928). (G) Sequence alignment showing the conserved LxCxE motif found in the Orc1 subunit of human, rat, mouse and hamster (upper part), and GST pull-down experiment performed with the in vitro translated Orc1 LPGRK protein (mutated in the LxCxE motif of Orc1) and the GST-fusion proteins AE, AB and SE (lower part).
Figure 3
Figure 3. E2F1 competes with Orc1 for binding to Rb.
(A) Schematic representation of the regions involved in the association of Rb to Orc1 and of those that are necessary for stable association with E2F1. (B) GST pull-down experiment performed by incubating a fixed amount of in vitro translated Orc1 together with scalar amounts of in vitro translated E2F1 with an immobilized GST fusion protein containing the ABC pocket of Rb. The graph shows the quantification of bound E2F1 and Orc1 radioactivity; the input lanes (In) contain the labelled proteins prior to binding. (C) Competitive GST pull-down control experiment performed with in vitro translated Orc1 and luciferase (Luc) proteins using identical experimental conditions as in (B).
Figure 4
Figure 4. Orc1 forms a stable complex with hypo-phosphorylated Rb inside the cells.
(A) Co-immunoprecipitation experiments performed with lysates from asynchronous HeLa cells using the indicated antibodies for immunoprecipitation and western blottings. (B) Immunodetection of endogenous Rb after co-immunoprecitation with exogenous HA-tagged Orc1 in transiently transfected asynchronous HeLa cells. Additional co-immunoprecipitations with Rb and E2F1 proteins in non-transfected and HA-Orc1-transfected HeLa cells were performed as controls. The band marked by an asterisk (*) represents an unspecific band detected with the mouse anti-Rb antibody IF8. (C) Endogenous Rb detected by western blotting after immunoprecipitation with anti-HA peptide antibody in non-transfected, wt HA-Orc1-, and mutant HA-Orc1 LPGRK-transfected U2OS cells. Additional immunoprecipitations for Rb were performed as controls on the same lysates. The band marked by an asterisk (*) represents an unspecific band detected with the mouse anti-Rb antibody IF8. (D) Immunoblotting to visualize the differently phosphorylated forms of endogenous Rb, after immunoprecipitation with anti-Rb and anti-HA peptide antibodies in U2OS cells not transfected or transfected with wt HA-Orc1, as indicated. Orc1 immunoprecipitated hypo-phoshorylated Rb, showing the same apparent mass as that obtained after treatment of total Rb immunoprecipitates with PP2A phosphatase.
Figure 5
Figure 5. FRET analysis.
(A) HeLa cells were transiently transfected with expression vectors coding for the proteins indicated on top of each panel fused to either EGFP (green color) or BFP (blue color). Individual transfected cells were visualized by excitation at 480 nm and collection at 520 nm, showing EGFP fluorescence after direct EGFP excitation (panels in the upper row), and by excitation at 350 nm and collection at 520 nm, showing EGFP fluorescence after BFP excitation, indicating FRET (panels in the lower row). The box plot below each image pair shows the quantification of FRET. Fluorescent emission at 520 nm from individual cells was recorded after excitation at 350 or 480 nm, and integrated intensities over the whole cell were evaluated. The percentile box-plot distribution of the ratio between these two measurements is shown by considering at least 10 consecutively analyzed cells for each protein pair. Horizontal lines of the percentile box plot distribution, from top to bottom, mark the 10th, 25th, 50th, 75th, and 90th percentile respectively. (B) FRET between Rb, tagged with BFP, and the same set of Orc1 truncation mutants considered for the GST pulldown experiments, tagged with EGFP.
Figure 6
Figure 6. Cell cycle-dependent association of Rb and E2F1 with the Lamin B2 origin.
(A) Experimental scheme for HeLa cell synchronization. HeLa cells were synchronized in mitosis by a double thymidine/nocodazole block, and then followed G1 after release from the block. (B) Flow cytometry profiles of asynchronous cells (Asynch), cells blocked in mitosis (0 hr) or cells at different times after release. (C) Western blot analysis of whole-cell extracts obtained from cells at different time points during synchronization. (D) Quantification of cross-linked lamin B2 origin DNA immunoprecipitated by ChIP. On top of the graph, the antibodies used for ChIP are shown. The histogram reports the results (mean±sem) of at least three independent experiments. The results are presented as the fold enrichment of the lamin B2 origin region (B48) over the irrelevant B10 region, after normalization for the levels of immunoprecipitated chromatin using an unrelated antibody (normal rabbit IgG) as control. (E) Experimental scheme for T98G cell synchronization. Cells were cultured without serum for 72 h and then followed for 20 h after addition of serum. (F) Flow cytometry profiles of asynchronous cells (Asynch), cells blocked in G0 by serum starvation (0 hr) or cells at different times after serum stimulation. (G) Western blot analysis of whole-cell extracts obtained from cells at different times points during synchronization. (H) Results of ChIP experiments for the lamin B2 origin, using the antibodies indicated on top of each dataset. The results are presented as in (D). AcH3: acetylated histone H3; AcH4: acetylated histone H4.
Figure 7
Figure 7. Down-regulation of Orc1 inhibits DNA replication and enhances E2F1 recruitment to origins of DNA replication.
(A) Western blotting using the indicated antibodies at 72 h after treatment of U2OS cells with siRNAs against Orc1 or luciferase (Luc) control. (B) Flow cytometry profiles of U2OS cells treated for 72 h with the indicated siRNAs. The histogram on the right side shows the distribution of the cells in the different phases of the cell cycle; the reduction in the number of S-phase cells after Orc1 silencing is indicated by an arrow. (C) Flow cytometry profiles simultaneously showing detection of DNA content (propidium iodide staining) and BrdU incorporation (anti-BrdU antibody) at 72 h after RNAi. The dashed boxes indicate BrdU positive, S-phase cells. The histogram on the right side reports the percentage of S-phase/BrdU positive cells (mean±sem, indicated by error bars) of three different experiments. The asterisk (*) indicates significant statistical difference between ORC depletion experiments and luciferase control experiments. (D) Results of ChIP experiments performed in U2OS cells at 72 h after siRNA silencing of Orc1. The histograms show the quantification of origin-specific, cross-linked and immunoprecipitated DNA for the Lamin B2 origin after immunoprecipitation using the antibodies shown below each bar pair. The results are expressed as fold of enrichment of the specific origin sequence (B48) over a neighbouring control sequence (B10), as shown in Fig. 1A . The means±sem of at least three different experiments are shown. The asterisk (*) indicates statistically significant differences between ORC depletion experiments and luciferase control experiments. (E) Results of ChIP experiments performed by analyzing protein binding to the GM-CSF Ori1 and Ori2 origins in U2OS cells at 72 h after siRNA silencing of Orc1. The results are expressed as in (D), by showing the fold of enrichment of the specific origin sequences (#17 and #23) over a neighbouring control sequence (#21), as schematically represented in Fig. 1C .

Similar articles

Cited by

References

    1. Bell SP, Dutta A. DNA replication in eukaryotic cells. Annu Rev Biochem. 2002;71:333–374. - PubMed
    1. Diffley JF. Regulation of early events in chromosome replication. Curr Biol. 2004;14:R778–786. - PubMed
    1. Giacca M, Falaschi A. Specification of DNA replication origins of mammalian genomes. Chemtracts. 2002;15:519–532.
    1. Stevaux O, Dyson NJ. A revised picture of the E2F transcriptional network and RB function. Curr Opin Cell Biol. 2002;14:684–691. - PubMed
    1. Tamrakar S, Rubin E, Ludlow JW. Role of pRB dephosphorylation in cell cycle regulation. Front Biosci. 2000;5:D121–D137. - PubMed

Publication types

MeSH terms