. 2010 Nov 15;5(11):e14000.
doi: 10.1371/journal.pone.0014000.

BMI, all-cause and cause-specific mortality in Chinese Singaporean men and women: the Singapore Chinese health study

Affiliations

BMI, all-cause and cause-specific mortality in Chinese Singaporean men and women: the Singapore Chinese health study

Andrew O Odegaard et al. PLoS One. .

Abstract

Background: The optimal range of relative weight for morbidity and mortality in Asian populations is an important question in need of more thorough investigation, especially as obesity rates increase. We aimed to examine the association between body mass index (BMI), all cause and cause-specific mortality to determine the optimal range of BMI in relation to mortality in Chinese men and women in Singapore.

Methodology/principal findings: We analyzed data from a prospective cohort study of 51,251 middle-aged or older (45-74) Chinese men and women in the Singapore Chinese Health Study. Participants were enrolled and data on body weight and covariates were collected in 1993-1998 and participants were followed through 2008. The analysis accounted for potential methodological issues through stratification on smoking and age, thorough adjustment of demographic and lifestyle confounders and exclusion of deaths early in the follow-up.

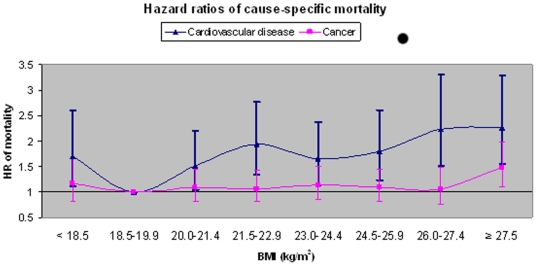
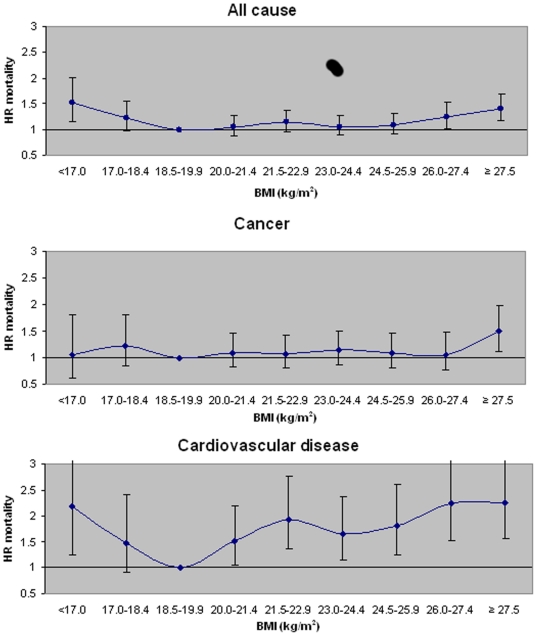
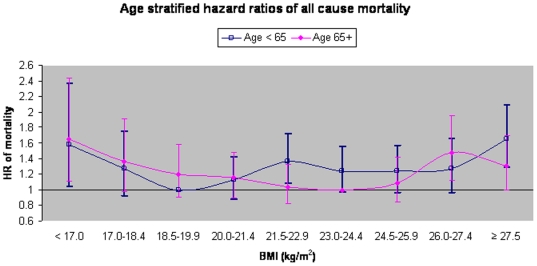
Conclusions/significance: Increased risk of mortality was apparent in underweight (<18.5) and obese BMI categories (≥27.5) independent of age and smoking. Regardless of age or BMI, smoking considerably increased the rate of mortality and modified the association between BMI and mortality. The most favorable range of BMI for mortality rates and risk in non-smoking persons below age 65 was 18.5-21.4 kg/m(2), and for non-smoking persons aged 65 and above was 21.5-24.4 kg/m(2).


Conflict of interest statement

Competing Interests: The authors have declared that no competing interests exist.

Figures

Figure 1
Figure 1. Hazard ratios of cause-specific mortality according to BMI.
Hazard ratios of cause specific mortality in non-smokers without reported prevalent disease and excluding deaths occurring within 5 years of baseline (N = 30,538). Models adjusted for age, sex, year of enrollment, dialect, education, dietary pattern score and physical activity. Points represent hazard ratio (HR) point estimate and error bars represent 95% confidence intervals. P for linear association for cardiovascular disease  = 0.0001. P trend for linear association for cancer  = 0.04. Respective mortality counts for cancer and cardiovascular mortality by BMI (<18.5, 18.5–19.9, 20–21.4, 21.5–22.9, 23–24.4, 24.5–25.9, 26–27.4, ≥27.5): Cancer (58, 75, 130, 146, 146, 112, 64, 117), Cardiovascular disease (46, 39, 96, 139, 111, 99, 72, 95). Respective age & sex standardized mortality rates per 10,000 years follow up: Cancer (23, 18, 20, 20, 21, 21, 20, 29) and Cardiovascular disease (18, 9, 15, 19, 16, 19, 23, 23).
Figure 2
Figure 2. Hazard ratios of mortality incorporating BMI groups <18.5 kg/m2.
Hazard ratios of all cause and cause specific mortality incorporating BMI groups less than 18.5 kg/m2 in non-smokers without reported prevalent disease and excluding deaths occurring within 5 years of baseline (N = 30,538); and adjusted for age, sex, year of enrollment, dialect, education, dietary pattern score and physical activity. Points represent hazard ratio (HR) point estimate and error bars represent 95% confidence intervals. P trend for quadratic association for all cause mortality = 0.0002. P trend for quadratic association for cardiovascular disease  = 0.0002. P trend for linear association for cancer  = 0.04.
Figure 3
Figure 3. Age stratified hazard ratios of all-cause mortality according to BMI.
Hazard ratios of all-cause mortality in participants aged less than 65 at baseline (N = 26,858, No. deaths = 1,344) and age 65+ (N = 3,680, No. deaths = 862). Figure encompasses all non-smokers who reported no prevalent disease and excludes deaths occurring within 5 years of baseline. Model is fully adjusted for age (continuous), sex, year of enrollment, dialect, education, dietary pattern score and physical activity. Points represent HR point estimate and error bars represent 95% confidence intervals. P value for interaction between age and BMI = 0.0001. Respective age & sex standardized mortality rates per 10,000 years follow up: Age<65 (48, 38, 28, 33, 40, 37, 39, 40, 51), Age 65+ (257, 219, 190, 194, 168, 161, 175, 226, 198).

References

    1. Yoon KH, Lee JH, Kim JW, Cho JH, Choi YH, et al. Epidemic obesity and type 2 diabetes in Asia. Lancet. 2006;368:1681–8. - PubMed
    1. Fontaine K, Allison DB. Obesity and Mortality Rates. In: Bray GA, editor. in Handbook of Obesity: Etiology and Pathophysiology. New York: Marcel Dekker; 2004. pp. 767–785.
    1. Whitlock G, Lewington S, Sherliker P, Clarke R, et al. Prospective Studies Collaboration. Body mass index and cause-specific mortality in 900,000 adults: colloborative analyses of 57 prospective studies. Lancet. 2009;373:1083–96. - PMC - PubMed
    1. Yuan J, Ross RK, Gao YT, Yu MC. Body weight and mortality: a prospective evaluation in a cohort of middle-aged men in Shanghai, China. Int J Epidem. 1998;27:824–832. - PubMed
    1. Tsugane S, Sasaki S, Tsubono Y. Under-and overweight impact on mortality among middle-aged Japanese men and women: a 10-y follow-up of JPHC study cohort I. Int J Obes. 2002;26:529–537. - PubMed

Publication types