. 2010 Nov 15;5(11):e13979.
doi: 10.1371/journal.pone.0013979.

Extensive co-operation between the Epstein-Barr virus EBNA3 proteins in the manipulation of host gene expression and epigenetic chromatin modification

Affiliations

Extensive co-operation between the Epstein-Barr virus EBNA3 proteins in the manipulation of host gene expression and epigenetic chromatin modification

Robert E White et al. PLoS One. .

Abstract

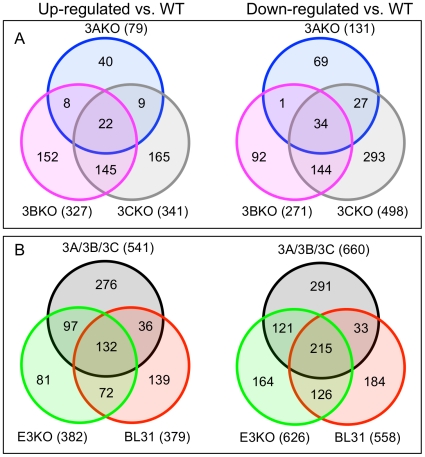
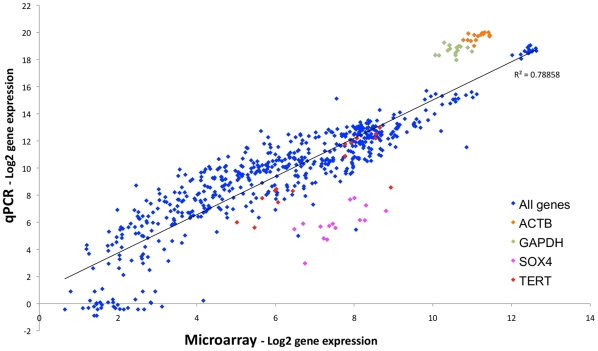
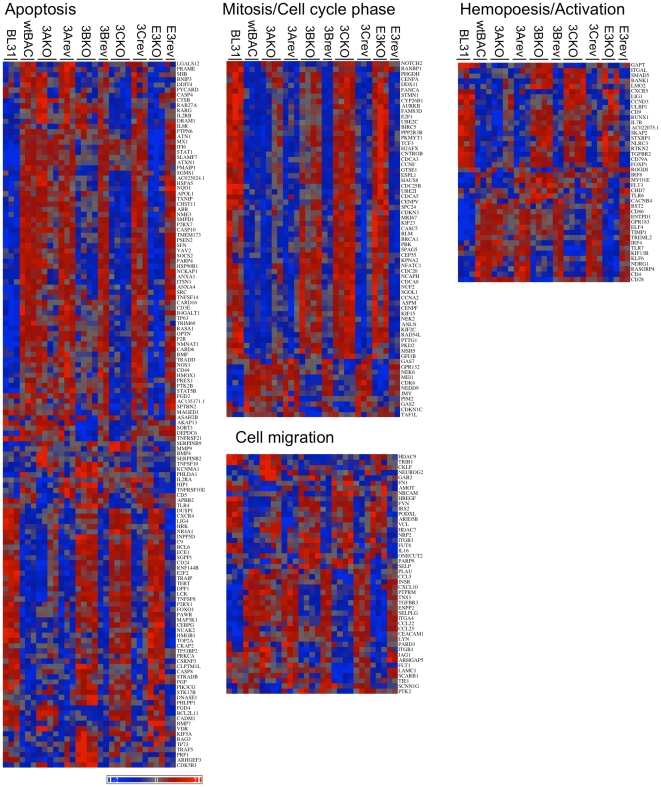
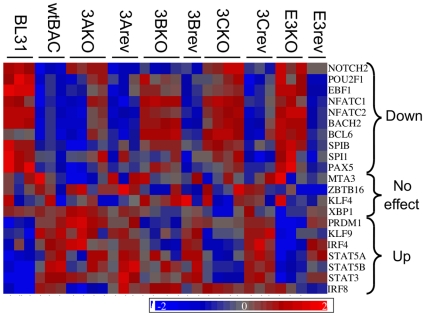
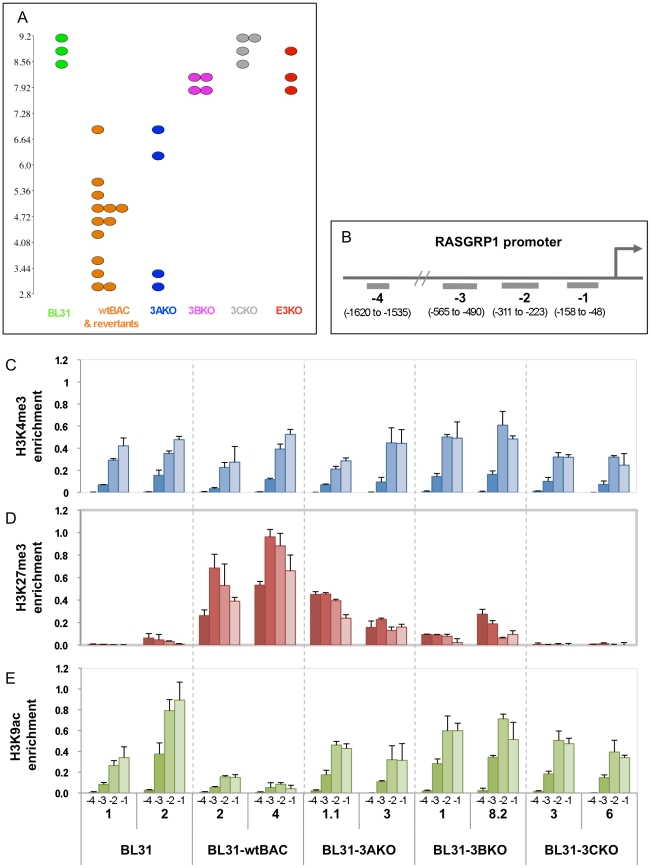
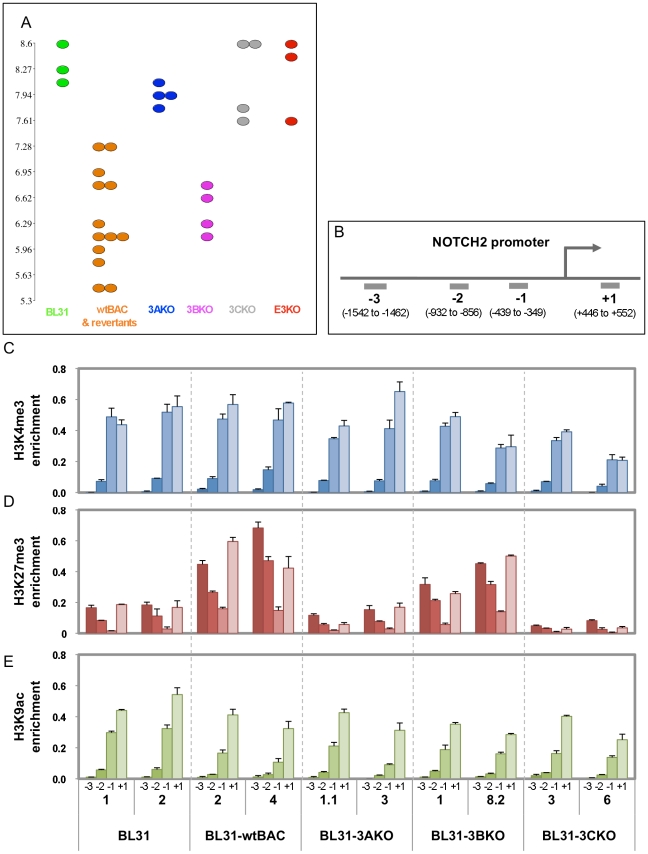
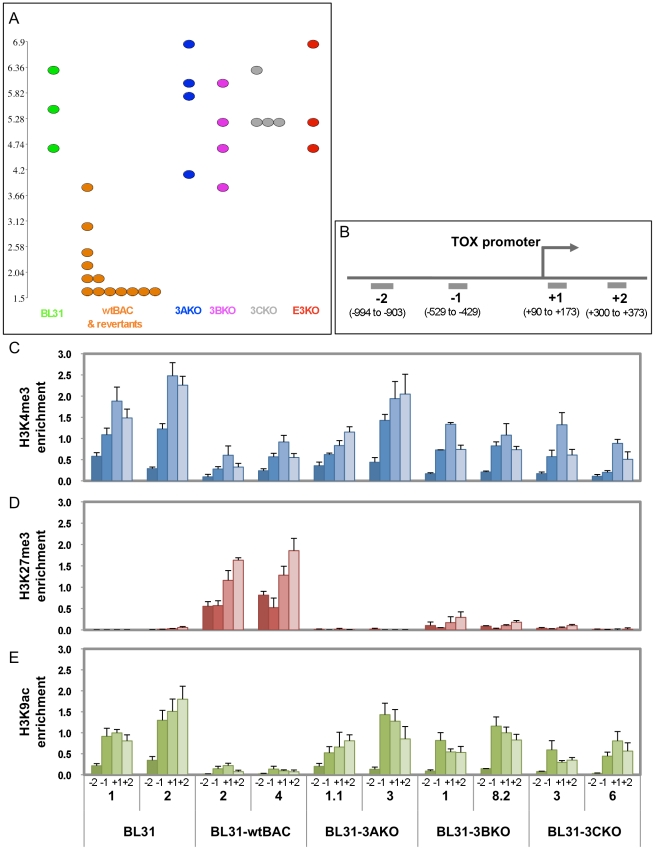
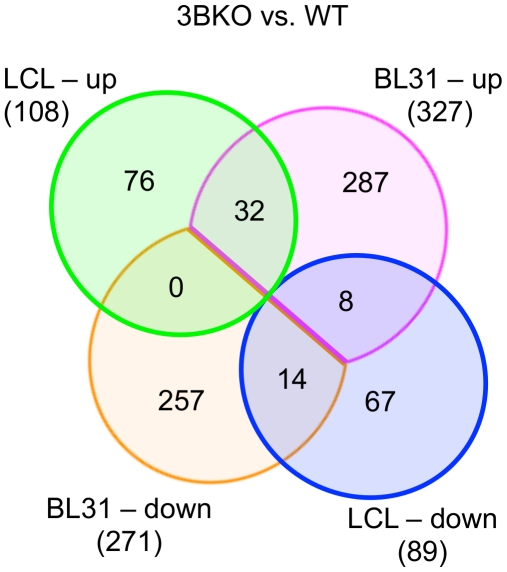
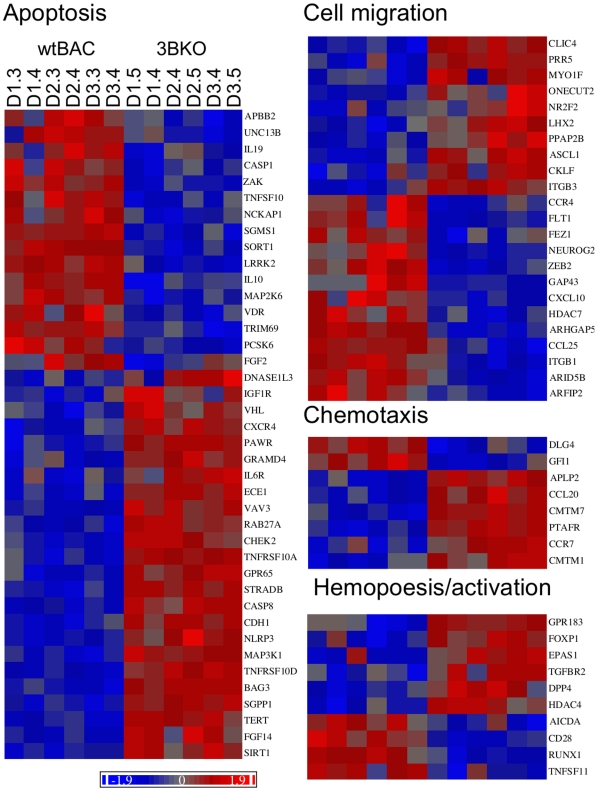
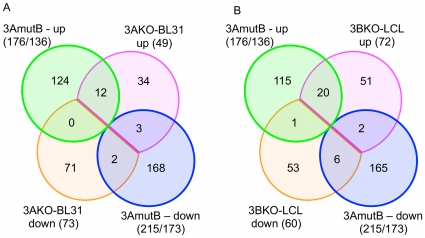
Epstein-Barr virus (EBV) is able to drive the transformation of B-cells, resulting in the generation of lymphoblastoid cell lines (LCLs) in vitro. EBV nuclear proteins EBNA3A and EBNA3C are necessary for efficient transformation, while EBNA3B is dispensable. We describe a transcriptome analysis of BL31 cells infected with a series of EBNA3-knockout EBVs, including one deleted for all three EBNA3 genes. Using Affymetrix Exon 1.0 ST microarrays analysed with the MMBGX algorithm, we have identified over 1000 genes whose regulation by EBV requires one of the EBNA3s. Remarkably, a third of the genes identified require more than one EBNA3 for their regulation, predominantly EBNA3C co-operating with either EBNA3B, EBNA3A or both. The microarray was validated by real-time PCR, while ChIP analysis of a selection of co-operatively repressed promoters indicates a role for polycomb group complexes. Targets include genes involved in apoptosis, cell migration and B-cell differentiation, and show a highly significant but subtle alteration in genes involved in mitosis. In order to assess the relevance of the BL31 system to LCLs, we analysed the transcriptome of a set of EBNA3B knockout (3BKO) LCLs. Around a third of the genes whose expression level in LCLs was altered in the absence of EBNA3B were also altered in 3BKO-BL31 cell lines.Among these are TERT and TCL1A, implying that EBV-induced changes in the expression of these genes are not required for B-cell transformation. We also identify 26 genes that require both EBNA3A and EBNA3B for their regulation in LCLs. Together, this shows the complexity of the interaction between EBV and its host, whereby multiple EBNA3 proteins co-operate to modulate the behaviour of the host cell.


Conflict of interest statement

Competing Interests: The authors have declared that no competing interests exist.

Figures

Figure 1
Figure 1. Overlap of genes differentially expressed by EBV mutant BL31 cells.
Each set in the Venn diagram contains the number of genes defined as differentially regulated (p value <0.001 and fold change >2) for the mutant group shown as compared to wtBAC-infected BL31. The total number of genes in the set is indicated below the set's identity. A. Numbers of genes differentially regulated in different combinations of EBNA3 knockout virus-infected BL31 cell lines are indicated. B. The combined group of genes falling in the venn diagrams from A (group 3A/3B/3C) is compared with genes differentially regulated between wtBAC-BL31s and E3KO-BL31s (bottom left set) or uninfected BL31 (bottom right set). Up-regulated vs WT (left side Venn diagrams) indicates genes whose expression was higher in the mutant-infected/uninfected BL31s than wtBAC-infected BL31s; down-regulated vs WT indicates lower expression in these lines.
Figure 2
Figure 2. Validation of microarray expression level data by qPCR.
The log2-transformed gene expression values of 42 genes were established for 16 of the BL31 cell lines, by qPCR analysis of the RNA samples previously used for the microarrays. These are plotted against the corresponding gene-level expression value from the MMBGX microarray analysis. Correlation coefficient and best-fit line are shown. Assays deviating from this trendline (GAPDH, ACTB and SOX4) are coloured as indicated. TERT is included for comparison with LCL data (Figure S4).
Figure 3
Figure 3. Relative expression of differentially regulated genes falling into significant ontological groups.
MMBGX-extracted gene expression levels were normalised to the mean and scaled by the standard deviation of the gene expression level for each gene – colour coding ranges from +2 to −2 standard deviations (see scale bottom left). These were grouped by ontological term, and where genes fell into multiple groups, they were placed in the group in the following order – Mitosis, apoptosis, cell migration, hemopoesis and activation. Genes within each group were ordered by unsupervised clustering.
Figure 4
Figure 4. EBV and EBNA3s alter the expression of B-cell differentiation-related transcription factors.
Heat map shows the relative expression levels of key transcription factors involved in B-cell differentiation. MMBGX-extracted gene expression levels were normalised to the mean and scaled by the standard deviation of the gene expression level for each gene – colour scale ranges from +2 to −2 standard deviations. Genes are grouped according to whether they are up- or down-regulated upon infection by EBV. Those not significantly altered are also indicated. Fold change and ANOVA contrast p values for these genes are shown in Figure S2.
Figure 5
Figure 5. Expression and epigenetic marks associated with a gene regulated by EBNA3B and EBNA3C; RASGRP1.
(A) Dotplot visualisation of expression level values of individual BL31 cell lines. EBV mutant used to generate the cell line is indicated below and colour-coded (BL31 indicates EBV-negative BL31 cell lines). Y axis shows expression level (MMBGX gene level analysis) on a log2 scale (ie each unit change indicates a doubling). (B) Schematic representation showing the location of ChIP qPCR assays relative to the transcriptional start site of the RASGRP1 promoter. (C-E) Bar charts indicate the percentage of input DNA recovered for each assay and each cell line for ChIPs using antibodies against trimethylated H3K4 (C), trimethylated H3K27 (D), and acetylated H3K9 (E). Numbers −1 to −4 relate to the assay position. Numbers below these are the clone IDs of the cell lines used.
Figure 6
Figure 6. Expression and epigenetic marks associated with a gene regulated by EBNA3A and EBNA3C; NOTCH2.
(A). Dotplot visualisation of expression level values of individual BL31 cell lines as described for figure 5A (B). Schematic representation indicates of location of ChIP qPCR assays relative to the transcriptional start site of the NOTCH2 promoter. (C-E) Bar charts indicate the percentage of input DNA recovered for each assay and each cell line, for ChIPs using antibodies against trimethylated H3K4 (C), trimethylated H3K27 (D), and acetylated H3K9 (E). Numbers +1 to −3 relate to the assay position. Numbers below these are the clone IDs of the cell lines used.
Figure 7
Figure 7. Expression and epigenetic marks associated with a gene regulated by EBNA3A, EBNA3B and EBNA3C; TOX.
(A) Dotplot visualisation of expression level values of individual BL31 cell lines as described for figure 5A (B). Schematic representation indicates of location of chromatin immunoprecipitation primer assays relative to the transcriptional start site of TOX promoter. (C-E) Bar charts indicate the percentage of input DNA recovered for each assay and each cell line, for ChIPs using antibodies against trimethylated H3K4 (C), trimethylated H3K27 (D), and acetylated H3K9 (E). Numbers +2 to −2 relate to the assay position. Numbers below these are the clone IDs of the cell lines used.
Figure 8
Figure 8. Overlap in EBNA3B-regulated genes between LCL and BL31 cell lines.
Venn diagram showing overlaps of genes whose regulation changes more than two-fold (p<0.001). The top two sets are of genes more highly expressed in the EBNA3B knockout cell lines than wtBAC cells; bottom two are down-regulated in 3BKO lines as labelled. The identities of the genes differentially expressed in both 3BKO BL31 and LCLs, and their ANOVA statistics are given in Table S6.
Figure 9
Figure 9. Ontological groupings of EBNA3B-regulated genes in LCLs.
MMBGX-extracted gene expression levels were normalised to the mean and scaled by the standard deviation of gene expression levels in LCLs for each gene, and coloured by relative expression (see scale). These were grouped by ontological term, and where genes fell into multiple groups, they were placed in the group in the following order - apoptosis, cell migration, chemotaxis and then hemopoesis/activation. Genes within each group were ordered by unsupervised clustering. Cell clone IDs are indicated at the top of the apoptosis heatmap and are in the same sequence for other categories.
Figure 10
Figure 10. Consistency between 3AKO BL31 and LCLs, and co-operation between EBNA3B and EBNA3A in LCLs.
Venn diagrams indicate overlap between genes differentially regulated [i.e. with a minimum fold change of 2 and p<0.001] in (A) 3AmutB LCLs and 3AKO BL31; and (B) 3AmutB and 3BKO LCLs. Numbers of genes are indicated in the sets and the size of each set indicated below the set name. For 3AmutB this is denoted as “(no of probesets/no of unique gene IDs)”. The 3AKO-BL31 and 3BKO-LCL sets exclude genes not represented in the U133 Plus2 microarray that was used to generate the 3AmutB LCL data.

References

    1. Young LS, Rickinson AB. Epstein-Barr virus: 40 years on. Nat Rev Cancer. 2004;4:757–768. - PubMed
    1. Swaminathan S. Noncoding RNAs produced by oncogenic human herpesviruses. Journal of Cellular Physiology. 2008;216:321–326. - PMC - PubMed
    1. Crawford DH. Biology and disease associations of Epstein-Barr virus. Philos Trans R Soc Lond, B, Biol Sci. 2001;356:461–473. - PMC - PubMed
    1. Thorley-Lawson DA, Gross A. Persistence of the Epstein-Barr virus and the origins of associated lymphomas. The New England Journal of Medicine. 2004;350:1328–1337. - PubMed
    1. Thorley-Lawson DA, Allday MJ. The curious case of the tumour virus: 50 years of Burkitt's lymphoma. Nat Rev Microbiol. 2008;6:913–924. - PubMed

Publication types

MeSH terms