. 2010 Nov 15;5(11):e13993.
doi: 10.1371/journal.pone.0013993.

Short-term environmental enrichment enhances adult neurogenesis, vascular network and dendritic complexity in the hippocampus of type 1 diabetic mice

Affiliations

Short-term environmental enrichment enhances adult neurogenesis, vascular network and dendritic complexity in the hippocampus of type 1 diabetic mice

Juan Beauquis et al. PLoS One. .

Abstract

Background: Several brain disturbances have been described in association to type 1 diabetes in humans. In animal models, hippocampal pathological changes were reported together with cognitive deficits. The exposure to a variety of environmental stimuli during a certain period of time is able to prevent brain alterations and to improve learning and memory in conditions like stress, aging and neurodegenerative processes.

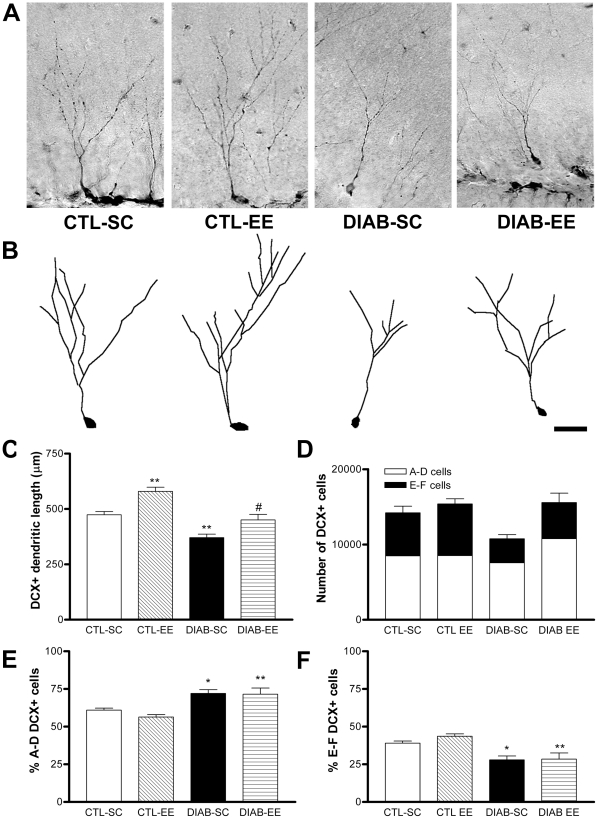
Methodology/principal findings: We explored the modulation of hippocampal alterations in streptozotocin-induced type 1 diabetic mice by environmental enrichment. In diabetic mice housed in standard conditions we found a reduction of adult neurogenesis in the dentate gyrus, decreased dendritic complexity in CA1 neurons and a smaller vascular fractional area in the dentate gyrus, compared with control animals in the same housing condition. A short exposure -10 days- to an enriched environment was able to enhance proliferation, survival and dendritic arborization of newborn neurons, to recover dendritic tree length and spine density of pyramidal CA1 neurons and to increase the vascular network of the dentate gyrus in diabetic animals.

Conclusions/significance: The environmental complexity seems to constitute a strong stimulator competent to rescue the diabetic brain from neurodegenerative progression.


Conflict of interest statement

Competing Interests: The authors have declared that no competing interests exist.

Figures

Figure 1
Figure 1. Experimental protocol and caging conditions.
(A) At 16 weeks of age, mice were injected with streptozotocin or vehicle correspondingly (day 0). At day 9, bromodeoxiuridine was administered i.p in order to label dividing cells. At day 10, mice were differentially housed under standard (SC) or enriched (EE) conditions until day 20 when perfusion was done. (B) Experimental cages. In the left panel a photograph of the standard caging (SC) condition is shown. A single plastic tube was included to reduce aggression between mice. The right panel corresponds to the environmental enrichment (EE) condition. Tunnel, toys, plastic houses and nesting material were provided. Scale bar corresponds to 10 cm.
Figure 2
Figure 2. Cell proliferation and survival.
(A) Quantification of the number of Ki67-positive cells in the subgranular zone (SGZ) of the dentate gyrus. The DIAB-EE group showed an increase compared with the DIAB-SC group (* p<0.05; post hoc test p>0.05 for every other group pair comparison) (B) Quantification of the number of BrdU-positive cells in the SGZ and granular cell layer (GCL) of the dentate gyrus labeled 10 days after the BrdU injection. The DIAB-SC group showed a decrease in the BrdU-positive cell survival compared with the CTL-SC (* p<0.05). An increase was found in the DIAB-EE group (# p<0.05 vs. DIAB-SC). (C) Representative microphotographs of the dentate gyrus with anti-BrdU immunohistochemistry. The inset in (A) shows a high magnification view of a cluster of BrdU-positive cells in the SGZ. Scale bar corresponds to 100 µm.
Figure 3
Figure 3. Neuronal differentiation of the BrdU-positive newborn cells.
(A) Confocal microscope image of a newborn cell in the subgranular zone (SGZ) showing double labeling for TuJ1 (left panel) and BrdU (center panel). In the right panel a merged image is shown. Scale bar corresponds to 10 µm. (B) Quantification of the percentage of BrdU-positive cells showing co-staining for TuJ1. The percentage was significantly decreased in the DIAB-SC group (** p<0.01 vs. CTL-SC) with DIAB-EE mice near control levels (## p<0.01 vs. DIAB-SC).
Figure 4
Figure 4. Doublecortin (DCX) immunostaining.
(A) Microphotographs corresponding to the DCX immunohistochemistry in the dentate gyrus. (B) Tracing of the dendritic tree of the DCX-positive neurons shown in panel A. Scale bar corresponds to 50 µm. (C) Quantification of the dendritic length of E-F-type DCX-positive neurons. Shorter dendritic trees were found in DIAB-SC mice (** p<0.01 vs. CTL-SC) and environmental enrichment prevented this reduction in the diabetic group (# p<0.05 DIAB-SC vs. DIAB-EE) and, also, in control mice (** p<0.05 CTL-SC vs. CTL-EE). (D) Quantification of the number of DCX-positive cells in the subgranular zone and granular cell layer. No differences were found between groups in the number of total DCX-positive cells and of A-D-type cells. We found a main effect of the ‘glycemic condition’ decreasing the number of E-F-type DCX-positive cells (p<0.01). (E) and (F) Percentage of DCX-positive cells showing an A–D (E panel, less mature) and an E–F phenotype (F panel, more mature; see the Materials and methods section for further details). Diabetic animals showed an increased percentage of A–D cells and a concomitant reduction in the E–F percentage (* p<0.05 DIAB-SC vs. CTL-SC and ** p<0.01 DIAB-EE vs. CTL-EE).
Figure 5
Figure 5. Golgi staining and Sholl analysis of pyramidal neurons in CA1.
(A) A camera lucida drawing of a pyramidal neuron and superimposed concentric circles used for Sholl analysis. The radius interval between circles was 20 µm per step, ranging from 20 µm to 300 µm from the center of the neuronal soma. Ranges analyzed for dendritic length: 20–100 µm range (dark grey zone), 120–200 µm range (light grey zone) and 220–300 µm (white zone). (B) Quantification of the number of intersections per circle. Significant differences were found in the circles ranging from 20 µm to 100 µm in DIAB-SC compared with CTL-SC (*** p<0.001) and an increase when comparing DIAB-EE with DIAB-SC at 20–140 µm (* p<0.05). (C) Quantification of the dendritic length of CA1 pyramidal neurons for the three distance ranges studied: 20–100 µm, 120–200 µm and 220–300 µm. Significant differences were found in the 20–100 µm range with a decrease in DIAB-SC mice (* p<0.05 vs. CTL-SC) and an increase in the DIAB-EE group (** p<0.01 vs. DIAB-SC). A main effect of ‘housing’ was found at 120–200 µm and 220–300 µm ranges (p<0.01 and p<0.05 respectively). (D) Camera lucida drawings of pyramidal neurons representative of each experimental group. Scale bar corresponds to 50 µm.
Figure 6
Figure 6. Dendritic spine density of CA1 pyramidal neurons.
(A) Microphotographs of dendrites stained with the Golgi technique. Scale bar corresponds to 2 µm. (B) and (C) The quantification evidenced a reduction of the spine density in apical (B) and basal (C) dendrites in DIAB-SC mice (* p<0.05 and *** p<0.001 respectively vs. CTL-SC) with an increase in the DIAB-EE group (** p<0.01 for both apical and basal dendrites vs. DIAB-SC).
Figure 7
Figure 7. Vascular network of the dentate gyrus.
(A) Representative microphotographs of the dentate gyrus showing the histochemistry for lectin Lycopersicon Esculentum. Scale bar corresponds to 100 µm. (B) Quantification of the lectin-positive fractional vascular area in the dentate gyrus. Results are expressed as the percentage of the area of the dentate gyrus occupied by blood vessels. Animals in the DIAB-SC group showed a smaller area percentage compared with CTL-SC mice (* p<0.05). Environmental enrichment positively regulated this parameter in diabetic mice (# p<0.05 vs. DIAB-SC).

References

    1. Biessels GJ, Gispen WH. The impact of diabetes on cognition: what can be learned from rodent models? Neurobiol Aging. 2005;26(Suppl 1):36–41. - PubMed
    1. McCall A. The impact of diabetes on the CNS. Diabetes. 1992;41:557–570. - PubMed
    1. Kamal A, Biessels GJ, Urban I, Gispen WH. Hippocampal synaptic plasticity in streptozotocin-diabetic rats: interaction of diabetes and ageing. Neuroscience. 1999;90:737–745. - PubMed
    1. Magariños A, McEwen B. Experimental diabetes in rats causes hippocampal dendritic and synaptic reorganization and increased glucocorticoid reactivity to stress. Proc Natl Acad Sci USA. 2000;97:11056–11061. - PMC - PubMed
    1. Saravia F, Revsin Y, Gonzalez-Deniselle MS, Roig P, Lima A, et al. Increased astrocyte reactivity in the hippocampus of murine models of type 1 diabetes: the nonobese diabetic (NOD) and streptozotocin-treated mice. Brain Research. 2002;957:345–353. - PubMed

Publication types