. 2010 Nov 11;6(11):e1001184.
doi: 10.1371/journal.ppat.1001184.

Hepatitis C virus (HCV) evades NKG2D-dependent NK cell responses through NS5A-mediated imbalance of inflammatory cytokines

Affiliations

Hepatitis C virus (HCV) evades NKG2D-dependent NK cell responses through NS5A-mediated imbalance of inflammatory cytokines

Damien Sène et al. PLoS Pathog. .

Abstract

Understanding how hepatitis C virus (HCV) induces and circumvents the host's natural killer (NK) cell-mediated immunity is of critical importance in efforts to design effective therapeutics. We report here the decreased expression of the NKG2D activating receptor as a novel strategy adopted by HCV to evade NK-cell mediated responses. We show that chronic HCV infection is associated with expression of ligands for NKG2D, the MHC class I-related Chain (MIC) molecules, on hepatocytes. However, NKG2D expression is downmodulated on circulating NK cells, and consequently NK cell-mediated cytotoxic capacity and interferon-γ production are impaired. Using an endotoxin-free recombinant NS5A protein, we show that NS5A stimulation of monocytes through Toll-like Receptor 4 (TLR4) promotes p38- and PI3 kinase-dependent IL-10 production, while inhibiting IL-12 production. In turn, IL-10 triggers secretion of TGFβ which downmodulates NKG2D expression on NK cells, leading to their impaired effector functions. Moreover, culture supernatants of HCV JFH1 replicating Huh-7.5.1 cells reproduce the effect of recombinant NS5A on NKG2D downmodulation. Exogenous IL-15 can antagonize the TGFβ effect and restore normal NKG2D expression on NK cells. We conclude that NKG2D-dependent NK cell functions are modulated during chronic HCV infection, and demonstrate that this alteration can be prevented by exogenous IL-15, which could represent a meaningful adjuvant for therapeutic intervention.


Conflict of interest statement

The authors have declared that no competing interests exist.

Figures

Figure 1
Figure 1. MIC proteins are overexpressed in HCV-infected liver.
Staining for MIC proteins in sections of paraffin-embedded (A–D) or cryopreserved (E, F) liver biopsies from HCV-negative control (A) or chronically HCV-infected patients (B–F). Control isotype is shown in (D). A strong and diffuse expression of MIC (red) is observed in hepatocytes from HCV-infected patients, in the cytoplasm (B, C) and at the membrane (E, confocal microscope analysis). MIC expression is seen in HCV infected cells (NS5A staining in green) and in some adjacent cells (F). Nuclei appear colored in blue. Results are representative of 12 patients for paraffin-embedded biopsies, and 3 patients for cryopreserved biopsies. Original magnification, ×10 (A, D), ×40 (E) and ×60 (F).
Figure 2
Figure 2. NKG2D levels and NK cell functions are altered in HCV-infected patients.
A) Freshly isolated PBMCs were stained with CD56, CD3 and NKG2D mAbs, and analyzed by FACS. Gating on CD3-CD56+ cells identified NK cells. Left panel: Representative NKG2D staining in one healthy control (dark line), one chronically-infected HCV patient (plain gray) and one HCV patient with sustained viral response (SVR, empty gray). Isotype control is shown in dotted line. Right panel: Combined data showing the mean NKG2D levels on NK cells from 23 controls, 41 HCV patients, 9 patients with SVR, and 9 patients with non-infectious inflammatory liver disease (ILD). Data are expressed as box plots, in which the horizontal lines illustrate the 25th, 50th, and 75th percentiles of the MFI of NKG2D. The vertical lines represent the 10th and 90th percentiles. * P<10−4, ** P<10−3. B) Frequency of CD107a+ degranulating (left panel) or IFNγ-producing (right panel) NK cells incubated for 6 hr in medium alone, or in the presence of MHC class I-negative K562 cells (E∶T ratio 1∶1). Results show the mean ± SEM values in 11 HCV patients and 15 healthy controls. * P = 0.003. C) Frequency of CD107a+ NK cells incubated for 6 hr with K562 cells (alone or in the presence of 20 µg/ml of NKG2D blocking mAb or control IgG), C1R cells or C1R-MICA transfectants. E∶T ratio 1∶1. Left panel: Combined data in 6 HCV patients (grey bars) and 6 healthy controls (white bars). * P = 0.003, ** P = 0.0001. Right panel: Dot plots show a representative experiment in one control (upper line) and one HCV patient (lower line). Numbers in the quadrant indicate the percentage of CD107a+ NK cells.
Figure 3
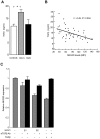
Figure 3. TGFβ is overproduced in HCV patients, and mediates NKG2D reduction on NK cells.
A) The levels of total TGFβ were significantly higher in serum from 34 HCV patients compared to 23 controls (* P = 0.008). Only 4 samples from SVR patients could be analyzed. B) Inverse correlation between serum TGFβ levels and NKG2D levels on NK cells in HCV patients. Pearson's correlation coefficient r = −0.49, P = 0.004. C) NKG2D levels are reduced in a TGFβ-dependent manner. NK cells were cultured in medium alone, or in medium containing 10% serum from representative HCV patients with known TGFβ concentration (S1: 6 ng/ml, i.e. 0.6 ng/ml final concentration; S2: 32 ng/ml, i.e. 3.2 ng/ml final concentration), or in medium containing 10 ng/ml of recombinant TGFβ. NKG2D expression was analyzed 24 hr later by flow cytometry. Addition of 10 µg/ml of neutralizing anti-TGFβ mAb during incubation largely reversed NKG2D reduction. Results are expressed as NKG2D levels on NK cells cultured in each indicated condition relative to the levels on NK cells cultured in medium alone, and represent mean ± SEM of 2 independent experiments. P = 0.02 for all comparisons (Kruskall Wallis test).
Figure 4
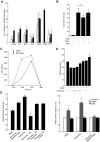
Figure 4. HCV-NS5A protein mediates TGFβ-induced downmodulation of NKG2D.
A) Control PBMCs (0.2×10⁶/ml) were stimulated with HCV-core, -E2, -NS3, -NS4, -NS5A or β2 microglobulin proteins at 0.1 µg/ml (white bars), 0.5 µg/ml (gray bars), or 1 µg/ml (black bars), or with recombinant TGFβ (10 ng/ml) for 48 h, and NKG2D expression was analyzed on CD3-CD56+ NK cells. Results are expressed as the percentage of inhibition of NKG2D expression in each condition relative to medium alone. Mean ± SEM of 3 independent experiments are shown. * P = 0.001. B) NS5A-mediated decrease in NK cell lytic potential. Control PBMCs were exposed to NS5A, NS4 or medium alone for 48 h, after which NK cell lytic potential to K562 target cells was evaluated by flow cytometry (CD107a expression). * P = 0.008. C) Kinetic analysis of TGFβ secretion upon 48 h stimulation of PBMCs (circles) or purified monocytes (squares) with 0.5 µg/ml of NS5A. TGFβ concentrations are given after background subtraction (cells cultured in medium alone). D) Pretreatment of PBMCs with increasing (0.01–3 µg/ml) concentrations of neutralizing TGFβ mAb prior to incubation with NS5A induces a dose-dependent increase of NKG2D on NK cells. E) Monocytes are the source of TGFβ upon NS5A stimulation. Left panel: The indicated cell populations were stimulated with 0.5 µg/ml of NS5A for 40 hr after which NKG2D expression was evaluated on NK cells. Results are expressed as NKG2D levels on NK cells in the indicated condition relative to the values in medium alone. NK cells were cultured with purified monocytes at the ratio of 1∶1 with or without Transwell (0.4 µm) separation or in the presence of 10 µg/ml anti-TGFβ mAb or isotype Ab. Data are mean ± SEM of 3 independent experiments. * P<0.002 for comparison with the values in medium alone. Right panel: Supernatants were harvested and assayed for TGFβ content. Values are normalized to TGFβ produced by cells cultured in medium alone and represent the mean ± SEM of 4 independent experiments. * P = 0.006, ** P = 0.0003.
Figure 5
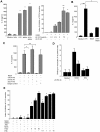
Figure 5. NS5A induces IL-10 and suppresses IL-12 production by monocytes through TLR4-mediated activation of p38 and PI3 kinase signaling.
A) Left panel: Control monocytes (0.1×10⁶/ml) were cultured in medium alone, or in the presence of NS4 (0.5 µg/ml), NS5A (0.5 µg/ml), LPS (1 µg/ml), or NS5A+LPS for 24 hr, and cell supernatants were analyzed for IL-10 by ELISA. Data are expressed as the mean ± SEM of three independent experiments. * P = 0.01. Right panel: Monocytes were pretreated with IL-10 neutralizing mAb or soluble IL-10 receptor prior to stimulation with NS5A, and TGFβ levels in the culture supernatants were quantified by ELISA. Results are expressed as index of inhibition of NS5A-mediated TGFβ levels, calculated as: [(TGFβ (NS5A) - TGFβ (NS5A+mAb))/TGFβ (NS5A) - TGFβ (medium)]x100, and are the mean ± SEM of three independent experiments. * P = 0.02, ** P = 0.0005. B) For IL-12p70 production, monocytes were first primed by IFNγ for 16 h and then stimulated with LPS (1 µg/ml), HCV-NS5A (0.5 µg/ml) or both for 24 hr, after which supernatants were analyzed for IL-12 by ELISA. Data are expressed as the mean ± SEM of three independent experiments. * P = 0.02, ** P = 0.001. C) Purified monocytes were pretreated with 5 µg/ml of anti-TLR4, -TLR2 or -CD14 neutralizing antibodies prior to 24 hr stimulation with 0.5 µg/ml of NS5A, after which IL-10 levels in the supernatants were measured by ELISA. Results are the mean ± SEM of IL-10 levels from mean replica values in 3 independent experiments. * P = 0.02, ** P = 0.01. D) Binding of NS5A to monocytes. Control monocytes were incubated for 30 min at 4°C with 0.5 µg/ml of recombinant NS5A, NS4 or medium alone. Binding of NS5A to monocytes was revealed by staining with anti-NS5A 9E10 antibody and flow cytometry analysis. Results are expressed as the percentage of positive cells, and are the mean of 4 independent experiments. E) Monocytes were left untreated, or treated with JNK inhibitor (SP600125, 10 µM), MEK inhibitor (U0126, 10 µM), PI3K inhibitor (LY294002, 1–50 µM), p38 inhibitor (SB203580, 0.1–10 µM) or DMSO alone as negative control, for 1 hr prior to stimulation with NS5A (0.5 µg/ml) for additional 24 h. Supernatants were assayed for IL-10 content by ELISA. Results represent the percentage of inhibition of IL-10 production, and are the mean ± SEM of 3 separate experiments. * P<0.01.
Figure 6
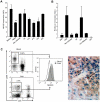
Figure 6. Supernatants of HCV-infected Huh-7.5.1 cells reproduce the effect of recombinant NS5A.
A) Control PBMCs were cultured for 48 hr in medium alone, in medium containing 0.5 µg/ml of recombinant NS5A, or in medium containing 50% of supernatant from non-infected or JFH1-replicating Huh-7.5.1 cells (collected at day 3, 13, 15 or 18 post transfection). NKG2D expression on NK cells was analyzed 48 hr later by flow cytometry. * P<0.05, ** P = 10−4 for comparison with the values in medium alone. B) Control monocytes were incubated for 30 min at 4°C with supernatants from non-infected or JFH1-infected Huh-7.5.1 cells collected at the indicated day post infection, or with 0.5 µg/ml of recombinant NS4 or NS5A proteins as negative and positive controls, respectively. Binding of NS5A to monocytes was revealed by staining with anti-NS5A 9E10 antibody and flow cytometry analysis. Results are expressed as the index of binding ([% binding with culture supernatant - % binding with medium alone]/% binding with medium alone), and represent mean ± SEM of 2 independent experiments. C) NKG2D expression on liver-infiltrating NK cells from HCV patients. Left panel: Representative NKG2D staining in paired circulating and liver-infiltrating NK cells freshly isolated from one chronically infected HCV patient. Dot plots and corresponding histograms show the frequency of NK cells (boxed CD3-CD56+) and their NKG2D expression. Right panel: NKG2D staining with anti-NKG2D mAb in liver biopsy from a chronically HCV-infected patient. Results are representative of 4 HCV patients. Only few NKG2D-positive cells (arrows) are found within a mononuclear infiltrate surrounding a portal tract. Original magnification, ×40.
Figure 7
Figure 7. NS5A-induced alterations of NKG2D are antagonized by exogenous IL-15.
A) IL-15 and TGFβ are opposite effects on NKG2D levels. Left panel: NKG2D staining on NK cells from one HCV patient cultured for 48 days in medium alone or in the presence of 10 ng/ml of IL-15. Results are representative of independent experiments in 3 patients. Medium and right panels: PBMCs from one control were cultured in the presence of 10 ng/ml of IL-15 with or without NS5A (0.5 µg/ml) or TGFβ-containing serum (S2: 32 ng/ml). Results are representative of independent experiments in 3 healthy controls. B) Purified NK cells from one HCV patient (upper panel) and one control (lower panel) were cultured for 36 hr with or without 10 ng/ml of IL-15 and/or 10 ng/ml TGFβ, after which lytic capacity to K562 target cells was measured. Numbers in the quadrant are the percentages of CD107a+ NK cells. Results are representative of 3 independent experiments.

Similar articles

Cited by

References

    1. Raulet DH. Interplay of natural killer cells and their receptors with the adaptive immune response. Nat Immunol. 2004;5:996–1002. - PubMed
    1. Lanier LL. NK cell recognition. Annu Rev Immunol. 2005;23:225–274. - PubMed
    1. Norris S, Collins C, Doherty DG, Smith F, McEntee G, et al. Resident human hepatic lymphocytes are phenotypically different from circulating lymphocytes. J Hepatol. 1998;28:84–90. - PubMed
    1. Khakoo SI, Thio CL, Martin MP, Brooks CR, Gao X, et al. HLA and NK cell inhibitory receptor genes in resolving hepatitis C virus infection. Science. 2004;305:872–874. - PubMed
    1. Golden-Mason L, Madrigal-Estebas L, McGrath E, Conroy MJ, Ryan EJ, et al. Altered natural killer cell subset distributions in resolved and persistent hepatitis C virus infection following single source exposure. Gut. 2008;57:1121–1128. - PubMed

Publication types

MeSH terms

Substances