. 2010 Nov 11;6(11):e1001188.
doi: 10.1371/journal.ppat.1001188.

HIV-1 induces DCIR expression in CD4+ T cells

Affiliations

HIV-1 induces DCIR expression in CD4+ T cells

Alexandra A Lambert et al. PLoS Pathog. .

Abstract

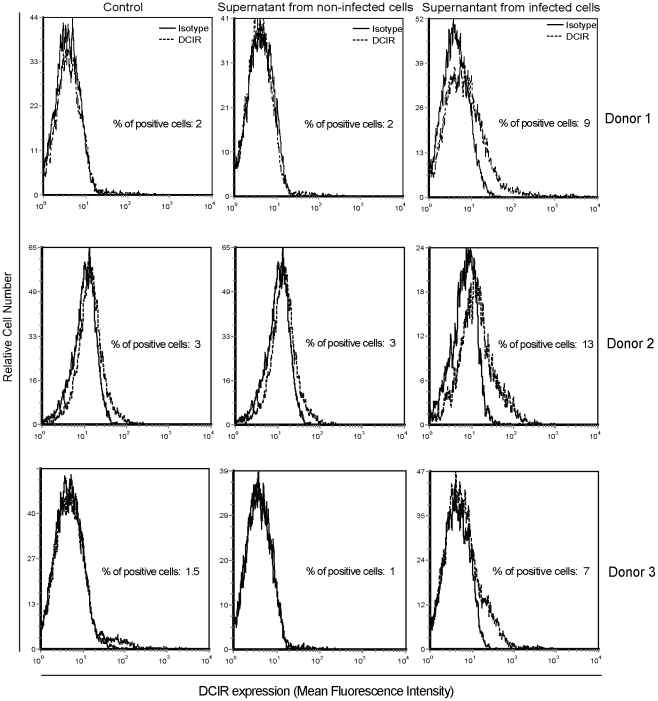
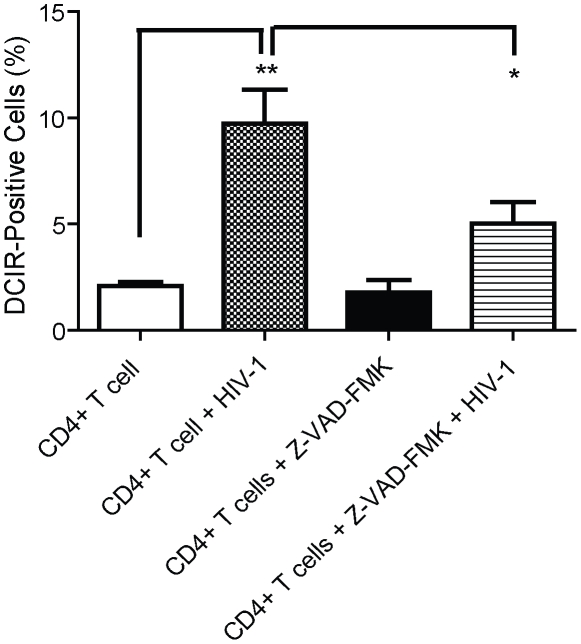
The C-type lectin receptor DCIR, which has been shown very recently to act as an attachment factor for HIV-1 in dendritic cells, is expressed predominantly on antigen-presenting cells. However, this concept was recently challenged by the discovery that DCIR can also be detected in CD4(+) T cells found in the synovial tissue from rheumatoid arthritis (RA) patients. Given that RA and HIV-1 infections share common features such as a chronic inflammatory condition and polyclonal immune hyperactivation status, we hypothesized that HIV-1 could promote DCIR expression in CD4(+) T cells. We report here that HIV-1 drives DCIR expression in human primary CD4(+) T cells isolated from patients (from both aviremic/treated and viremic/treatment naive persons) and cells acutely infected in vitro (seen in both virus-infected and uninfected cells). Soluble factors produced by virus-infected cells are responsible for the noticed DCIR up-regulation on uninfected cells. Infection studies with Vpr- or Nef-deleted viruses revealed that these two viral genes are not contributing to the mechanism of DCIR induction that is seen following acute infection of CD4(+) T cells with HIV-1. Moreover, we report that DCIR is linked to caspase-dependent (induced by a mitochondria-mediated generation of free radicals) and -independent intrinsic apoptotic pathways (involving the death effector AIF). Finally, we demonstrate that the higher surface expression of DCIR in CD4(+) T cells is accompanied by an enhancement of virus attachment/entry, replication and transfer. This study shows for the first time that HIV-1 induces DCIR membrane expression in CD4(+) T cells, a process that might promote virus dissemination throughout the infected organism.


Conflict of interest statement

The authors have declared that no competing interests exist.

Figures

Figure 1
Figure 1. HIV-1 induces DCIR expression in CD4+ T cells under both in vivo and in vitro conditions.
Purified CD4+ T cells were isolated from uninfected healthy donors and two HIV-1-infected aviremic/treated persons (P<0.05) (A) or three viremic/treatment-naive patients (P<0.001) (B). Next, cells (1×10⁶) were stained with the R-PE-labeled anti-DCIR monoclonal Ab. Expression of DCIR is shown as a dotted line, whereas the continuous line represents staining obtained with an isotype-matched irrelevant control Ab. For uninfected healthy donors, data shown correspond to a single experiment representative of 5 distinct donors. (C) Purified human primary CD4+ T cells (1×10⁶) were pulsed or not with NL4-3 (100 ng of p24). Three days later, DCIR expression was evaluated by flow cytometric analysis through the use of a R-PE-labeled anti-DCIR monoclonal Ab. Expression of DCIR is shown as a dotted line, whereas the continuous line represents results obtained with an isotype-matched irrelevant control Ab. Data shown in panel C correspond to a single experiment representative of 3 independent experiments (P<0.01). Statistical analyses were made by comparing fluorescence intensities in samples from HIV-1-infected patients or NL4-3-infected cells and the isotype-matched irrelevant control Ab.
Figure 2
Figure 2. DCIR is expressed in both virus-infected and bystander CD4+ T cells.
Cells (1×10⁶) were either left (A) uninfected or (B) infected with NL4-3-IRES-HSA reporter virus (100 ng of p24). Three days later, a double-stain flow cytometric method was performed to assess the percentages of DCIR-expressing and HSA-positive cells. Data shown correspond to a single experiment representative of 3 independent experiments.
Figure 3
Figure 3. Soluble factors secreted by virus-infected cells promote DCIR expression.
Cell-free supernatants from mock- and HIV-1-infected cells were used to treat purified CD4+ T cells. DCIR expression was monitored 3 days later by flow cytometry. Expression of DCIR is shown as a dotted line, whereas the continuous line represents staining obtained with an isotype-matched irrelevant control Ab. Data shown correspond to studies performed with three distinct donors.
Figure 4
Figure 4. Virus-mediated induction of DCIR is partly prevented by a caspase inhibitor.
Mitogen-activated CD4+ T cells (1×10⁶) were first either left untreated or treated for 1 h with the caspase inhibitor Z-VAD-FMK (50 nM), after which HIV-1 was added (100 ng of p24), where indicated. DCIR expression was monitored 3 days later by flow cytometry. Data shown represent the means ± SD of triplicate samples from three independent experiments. Asterisks denote statistically significant data (*, P<0.05; **, P<0.01).
Figure 5
Figure 5. HIV-1-dependent DCIR induction is due also to a caspase-independent process involving AIF.
Cells (1×10⁶) were first either left untreated or treated for 1 h with NAC, after which HIV-1 (100 ng of p24) was added. DCIR expression was monitored 3 days later by flow cytometry. Expression of DCIR is shown as a dotted line, whereas the continuous line represents staining obtained with an isotype-matched irrelevant control Ab. Data shown correspond to 3 independent experiments performed with distinct healthy donors.
Figure 6
Figure 6. H2O2 produced by HIV-1-infected cells promotes DCIR expression.
Mitogen-stimulated CD4+ T cells (1×10⁶) were either left untreated or treated with catalase before HIV-1 infection. Three days after virus infection, DCIR expression was measured by flow cytometry. Data shown represent the means ± SD of triplicate samples from three independent experiments. Asterisks denote statistically significant data (**, P<0.01; ***, P<0.001).
Figure 7
Figure 7. H2O2 mediates both apoptosis and DCIR expression.
Mitogen-stimulated CD4+ T cells (1×10⁶) were exposed to increasing concentrations of H2O2 for 16 h (A) or treated with a constant dose of H2O2 (i.e. 30 µM) for the indicated time lengths (B). Next, DCIR expression was assessed by flow cytometry. Data shown represent the ratio of DCIR expression over basal expression. The ratio is calculated from the means ± SD of triplicate samples from three independent experiments. Asterisks denote statistically significant data (*, P<0.05; **, P<0.01; ***, P<0.001).
Figure 8
Figure 8. H2O2 treatment drives DCIR expression in both nonapoptotic and apoptotic cells.
(A) Mitogen-activated CD4+ T cells (1×10⁶) were first either left untreated or treated for 1 h with the caspase inhibitor Z-VAD-FMK (50 nM), after which H2O2 (30 µM) was added, where indicated. DCIR expression was monitored 16 h later by flow cytometry. Expression of DCIR is shown as a dotted line, whereas the continuous line represents staining obtained with an isotype-matched irrelevant control Ab. Data shown correspond to a single experiment representative of 3 independent experiments. (B) Mitogen-stimulated CD4+ T cells (1×10⁶) were first treated for 16 h with H2O2 (i.e. 30 µM). Thereafter, DCIR surface expression and caspase activation were monitored by flow cytometric analysis using a double-staining method consisting of FITC-VAD-FMK followed by the R-PE-conjugated anti-DCIR. Data shown correspond to a single experiment representative of 4 independent experiments.
Figure 9
Figure 9. HIV-1 attachment/entry, replication and transfer processes are all promoted in H2O2-treated CD4+ T cells.
Target CD4+ T cells (1×10⁶) were treated for 16 h with H2O2 (30 µM) to induce surface expression of DCIR. (A) Cells were next exposed to NL4-3 (100 ng of p24) for 1 h at 37°C, extensively washed to remove unabsorbed virons before assessing the p24 content. (B) Cells were first incubated with NL4-3 (100 ng of p24) for 2 h at 37°C, washed extensively to remove input virus and cultured in complete culture RPMI-1640 medium supplemented with rhIL-2 for the indicated number of days. Cell-free supernatants were collected and assayed for the p24 content. (C) Cells were exposed to NL4-3 (100 ng of p24) for 2 h at 37°C, next washed extensively to remove input virus, and finally co-cultured with autologous CD4+ T cells in complete culture RPMI-1640 medium supplemented with rhIL-2 for the indicated number of days. Cell-free supernatants were collected and assayed for the p24 content. Virus production at day 2 is depicted in the small inserts (panels B and C). (D) Cells were exposed to NL4-3 (100 ng of p24) for 2 h at 37°C, washed extensively to remove input virus, and maintained in complete culture medium supplemented with rhIL-2 for 3 days. Next, DCIR-negative and -positive cells (used as transmitter cells) were isolated with magnetic beads and co-cultured with uninfected CD4+ T cells (used as recipient cells). Cell-free supernatants were collected at 3 days following initiation of the co-culture and assayed for the p24 content. (E) Cells were first exposed to NL4-3 for 2 h at 37°C. Cells were extensively washed to remove unabsorbed virions and half of the cells were used to estimate the percentage of cells positive for surface DCIR and intracellular p24. (F) The other half was maintained for 3 days in culture before assessing both DCIR and p24. Data shown represent the means±SD of triplicate samples and correspond to a single experiment representative of three independent experiments. Asterisks denote statistically significant data (*, P<0.05; **, P<0.01; ***, P<0.001).
Figure 10
Figure 10. Proposed working models for DCIR involvement in HIV-1 infection.
DCIR expression is promoted not only in cells productively infected with HIV-1 but also in bystander cells via both a mitochondrial (intrinsic) caspase-dependent apoptotic pathway and a caspase-independent apoptotic process relying on AIF. The resulting DCIR induction on the surface of CD4+ T cells can affect virus replication by various means. For example, virus binding can be increased through DCIR, a process leading to a more efficient HIV-1 propagation. Moreover, the cell cycle arrest seen in DCIR-expressing cells can also promote virus attachment and the ensuing HIV-1 transmission despite apoptosis induction because of the association between DCIR and SHP-1. It can also be postulated that DCIR expression on the surface of apoptotic CD4+ T cells also infected with HIV-1 might facilitate phagocytosis by macrophages and DCs, thereby favoring infection of such antigen-presenting cells and viral propagation.

Similar articles

Cited by

References

    1. Bates EE, Fournier N, Garcia E, Valladeau J, Durand I, et al. APCs express DCIR, a novel C-type lectin surface receptor containing an immunoreceptor tyrosine-based inhibitory motif. J Immunol. 1999;163:1973–1983. - PubMed
    1. Fujikado N, Saijo S, Yonezawa T, Shimamori K, Ishii A, et al. DCIR deficiency causes development of autoimmune diseases in mice due to excess expansion of dendritic cells. Nat Med. 2008;14:176–180. - PubMed
    1. Lambert AA, Gilbert C, Richard M, Beaulieu AD, Tremblay MJ. The C-type lectin surface receptor DCIR acts as a new attachment factor for HIV-1 in dendritic cells and contributes to trans- and cis-infection pathways. Blood. 2008;112:1299–1307. - PMC - PubMed
    1. Eklow C, Makrygiannakis D, Backdahl L, Padyukov L, Ulfgren AK, et al. Cellular distribution of the C-type II lectin dendritic cell immunoreceptor (DCIR) and its expression in the rheumatic joint: identification of a subpopulation of DCIR+ T cells. Ann Rheum Dis. 2008;67:1742–1749. - PubMed
    1. Goronzy JJ, Weyand CM. Rheumatoid arthritis. Immunol Rev. 2005;204:55–73. - PubMed

Publication types

MeSH terms