. 2010 Nov 11;6(11):e1001193.
doi: 10.1371/journal.pgen.1001193.

A coastal cline in sodium accumulation in Arabidopsis thaliana is driven by natural variation of the sodium transporter AtHKT1;1

Affiliations

A coastal cline in sodium accumulation in Arabidopsis thaliana is driven by natural variation of the sodium transporter AtHKT1;1

Ivan Baxter et al. PLoS Genet. .

Abstract

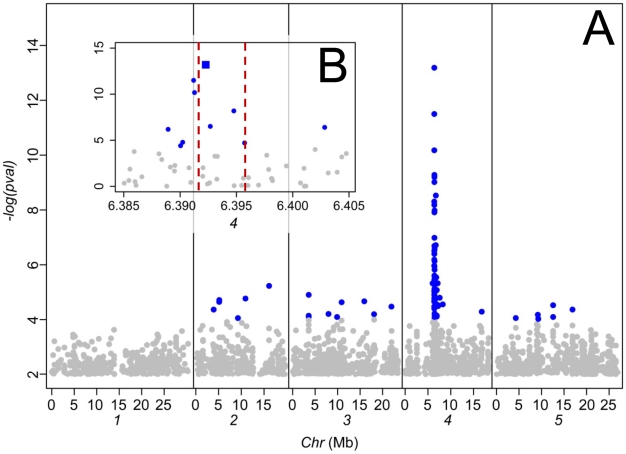
The genetic model plant Arabidopsis thaliana, like many plant species, experiences a range of edaphic conditions across its natural habitat. Such heterogeneity may drive local adaptation, though the molecular genetic basis remains elusive. Here, we describe a study in which we used genome-wide association mapping, genetic complementation, and gene expression studies to identify cis-regulatory expression level polymorphisms at the AtHKT1;1 locus, encoding a known sodium (Na(+)) transporter, as being a major factor controlling natural variation in leaf Na(+) accumulation capacity across the global A. thaliana population. A weak allele of AtHKT1;1 that drives elevated leaf Na(+) in this population has been previously linked to elevated salinity tolerance. Inspection of the geographical distribution of this allele revealed its significant enrichment in populations associated with the coast and saline soils in Europe. The fixation of this weak AtHKT1;1 allele in these populations is genetic evidence supporting local adaptation to these potentially saline impacted environments.


Conflict of interest statement

The authors have declared that no competing interests exist.

Figures

Figure 1
Figure 1. A coastal/saline soil cline in leaf Na+ accumulation in A. thaliana driven by natural variation at the AtHKT1;1 locus.
A. Map showing the geographical position for the collection site of 300 accessions of A. thaliana. The genotype at Chr4:6392276 of each accession is represented by the type of symbol (red triangle Chr4:6392276 = T, blue circle Chr4:6392276 = C). Leaf Na+ accumulation of each accession, measured in a common garden experiment, is represented by the size of the symbols. Known areas of saline soils were obtained from Tóth et al., and are represented here in green. B. Leaf Na+ accumulation in 300 accessions of A. thaliana, measured in a common garden experiment, and its relationship with the distance to the collection site of each accession to the coast or known saline soils (whichever is the smallest). Red symbols genotype at Chr4:6392276 = T, blue symbols genotype at Chr4:6392276 = C. Dashed black line represents the average leaf Na+ for the Col-0 accession.
Figure 2
Figure 2. Genome-wide association analysis of leaf Na+ accumulation in 349 A. thaliana accessions grown in a common garden.
A. Genome-wide p-values from a mixed model analysis implemented in EMMA . Associations with a p-value>0.001 are shaded in grey. B. Magnification of the genomic region surrounding AtHKT1;1, the position and extent of which is indicated by vertical lines (locus At4g10310 Chr4:6391984–6395877). The SNP most significantly associated with leaf Na+ accumulation (Chr4:6392276) is represented by a square symbol, all other SNPs represented by circles. Mb, megabase.
Figure 3
Figure 3. AtHKT1;1 allele strength in various A. thaliana accessions assessed by genetic complementation and expression level.
A. Leaf Na+ accumulation of F1 plants generated from crosses of various accessions to either Col-0hkt1-1 (squares) or Col-0HKT1 (circles) compared to leaf Na+ accumulation of the non-Col parent of the cross, and represented as a percentage of leaf Na+ accumulation of Col-0hkt1-1. Solid line represents linear regression of data represented by square symbols, dashed line represents linear regression of data represented by circular symbols. B. Root expression level of AtHKT1;1 in various accessions as determined by qRT-PCR, represented as relative to AtHKT1;1 expression in Col-0, and compared to leaf Na+ accumulation. Red symbols genotype at Chr4:6392276 = T, blue symbols genotype at Chr4:6392276 = C.

Comment in

  • Beyond QTL cloning.
    Anderson JT, Mitchell-Olds T. Anderson JT, et al. PLoS Genet. 2010 Nov 11;6(11):e1001197. doi: 10.1371/journal.pgen.1001197. PLoS Genet. 2010. PMID: 21085636 Free PMC article. No abstract available.

Similar articles

Cited by

References

    1. Wilczek AM, Roe JL, Knapp MC, Lopez-Gallego C, Martin LJ, et al. Effects of genetic perturbation on seasonal life history plasticity. Science. 2009;323:930–934. - PubMed
    1. Paaby AB, Blacket MJ, Hoffmann AA, Schmidt PS. Identification of a candidate adaptive polymorphism for Drosophila life history by parallel independent clines on two continents. Mol Ecol. 2010;19:760–774. - PubMed
    1. McKechnie SW, Blacket MJ, Song SV, Rako L, Carroll X, et al. A clinally varying promoter polymorphism associated with adaptive variation in wing size in Drosophila. Mol Ecol. 2010;19:775–784. - PubMed
    1. Storz JF, Runck AM, Sabatino SJ, Kelly JK, Ferrand N, et al. Evolutionary and functional insights into the mechanism underlying high-altitude adaptation of deer mouse hemoglobin. Proc Natl Acad Sci U S A. 2009;106:14450–14455. - PMC - PubMed
    1. Brady K, Kruckeberg A, Bradshaw HJ. Evolutionary ecology of plant adaptation to serpentine soils. Annual Review of Ecology, Evolution, and Systematics. 2005;36:243–266.

Publication types

MeSH terms