

Urban scaling and its deviations: revealing the structure of wealth, innovation and crime across cities
- PMID: 21085659
- PMCID: PMC2978092
- DOI: 10.1371/journal.pone.0013541
Urban scaling and its deviations: revealing the structure of wealth, innovation and crime across cities
Abstract
With urban population increasing dramatically worldwide, cities are playing an increasingly critical role in human societies and the sustainability of the planet. An obstacle to effective policy is the lack of meaningful urban metrics based on a quantitative understanding of cities. Typically, linear per capita indicators are used to characterize and rank cities. However, these implicitly ignore the fundamental role of nonlinear agglomeration integral to the life history of cities. As such, per capita indicators conflate general nonlinear effects, common to all cities, with local dynamics, specific to each city, failing to provide direct measures of the impact of local events and policy. Agglomeration nonlinearities are explicitly manifested by the superlinear power law scaling of most urban socioeconomic indicators with population size, all with similar exponents (1.15). As a result larger cities are disproportionally the centers of innovation, wealth and crime, all to approximately the same degree. We use these general urban laws to develop new urban metrics that disentangle dynamics at different scales and provide true measures of local urban performance. New rankings of cities and a novel and simpler perspective on urban systems emerge. We find that local urban dynamics display long-term memory, so cities under or outperforming their size expectation maintain such (dis)advantage for decades. Spatiotemporal correlation analyses reveal a novel functional taxonomy of U.S. metropolitan areas that is generally not organized geographically but based instead on common local economic models, innovation strategies and patterns of crime.
Conflict of interest statement
Figures
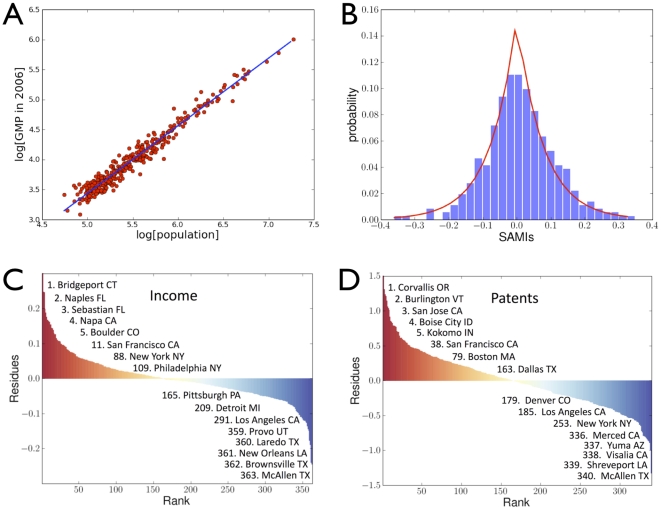
 = 1.126 (95% CI [1.101,1.149]). b) Histogram showing frequency of residuals, (SAMIs, see Eq. (2)); the statistics of residuals is well described by a Laplace distribution (red line). Scale independent ranking (SAMIs) for US MSAs by c) personal income and d) patenting (red denotes above average performance, blue below). For more details see Text S1, Table S1 and Figure S1.
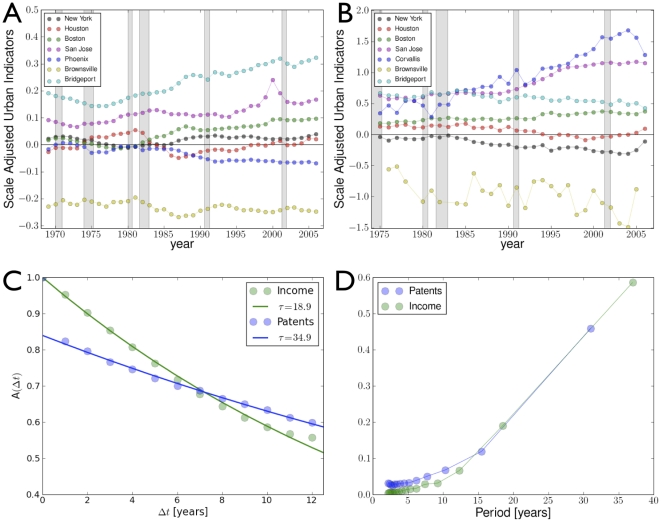
 , with characteristic decay times of
  = 18.9 and 34.9 years, respectively and d) temporal Fourier power spectrum for the same quantities shows that their dynamics is dominated by long timescales.
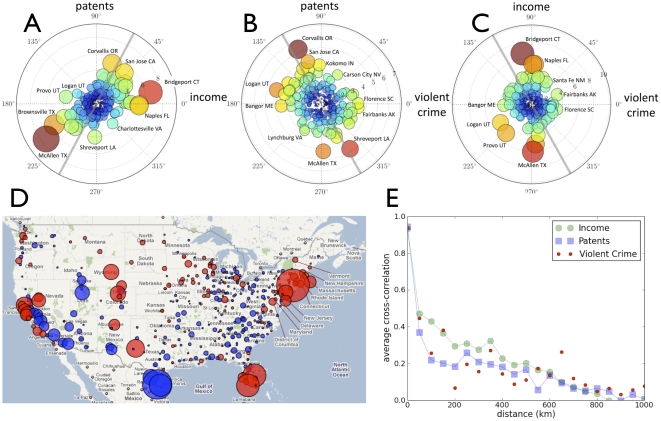
 0.04,
0.04,  = 0.20). The color and size of circles both denote the magnitude of the combined SAMIs for each city; b) similar representation for income versus violent crime with best-fit linear relation (gradient = −0.19
 0.07,
0.07,  = 0.05), and c) similar representation for patents versus violent crime with best-fit linear relation (gradient = −0.34
 0.05,
0.05,  = 0.12). Note that B) and C) show a small amount of anti-correlation between SAMIs, which contrasts with the positive correlations for the per capita quantities due to their size dependence. d) Spatial distribution of income residuals (SAMIs) in 2006 (created with Google maps, see online (
 200 km (124 miles) with standard deviation
  0.6.
0.6.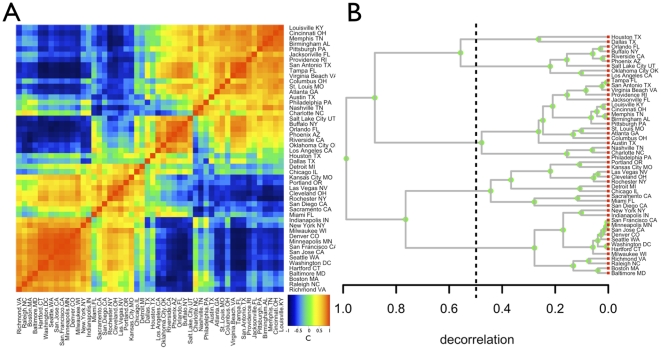
 as distance between any two cities, where
  is the cross-correlation of Figure 4A. When the decorrelation
  ,
,  , indicating no correlation(dashed line), revealing five families of kindred cities. See Figures S2, S3, S4, S5, S6, and S7 for other quantities.
References
-
- Ash C, Jasny BR, Roberts L, Stone R, Sugden AM. Reimagining Cities. Science. 2008;319:739. - PubMed
-
- UN-HABITAT (United Nations Human Settlements Program) 2009. State of the world's cities 2008–9. Available: http://www.unhabitat.org.
-
- US Bureau of Economic Analysis (GMP, income, wages), Available: http://www.bea.gov/; Eurostat's Urban Audit, Available: http://www.urbanaudit.org/; Brazil's Instituto Brasileiro de Geografia e Estatistica, Available: http://www.ibge.gov.br/english/
-
- FBI's Uniform Crime Reports. Available: http://www.fbi.gov/ucr/cius2008/index.html.
-
- Feldman MP, Audretsch DB. Innovation in cities: Science-based diversity, specialization and localized competition. Europ Econ Rev. 1999;43:409–429.
Publication types
MeSH terms
LinkOut - more resources
Full Text Sources
Research Materials
