

Phenotypic complexity, measurement bias, and poor phenotypic resolution contribute to the missing heritability problem in genetic association studies
- PMID: 21085666
- PMCID: PMC2978099
- DOI: 10.1371/journal.pone.0013929
Phenotypic complexity, measurement bias, and poor phenotypic resolution contribute to the missing heritability problem in genetic association studies
Abstract
Background: The variance explained by genetic variants as identified in (genome-wide) genetic association studies is typically small compared to family-based heritability estimates. Explanations of this 'missing heritability' have been mainly genetic, such as genetic heterogeneity and complex (epi-)genetic mechanisms.
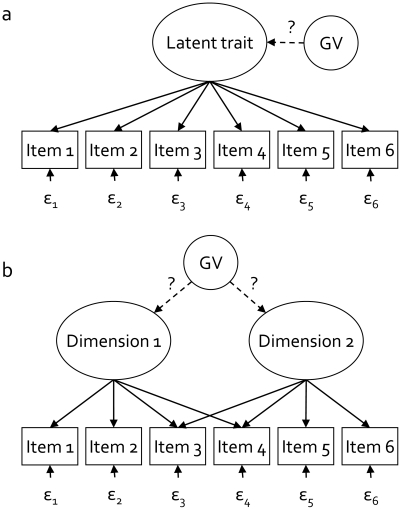
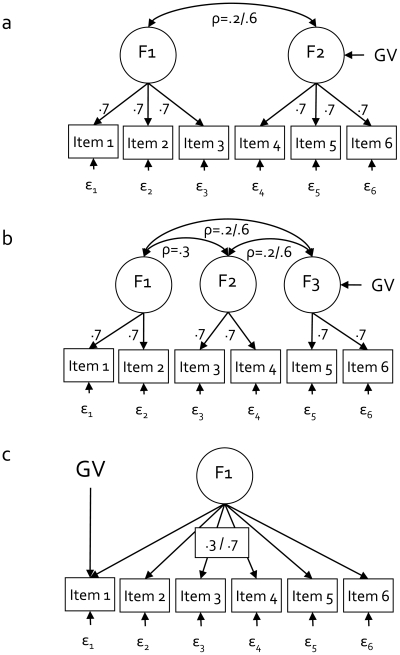
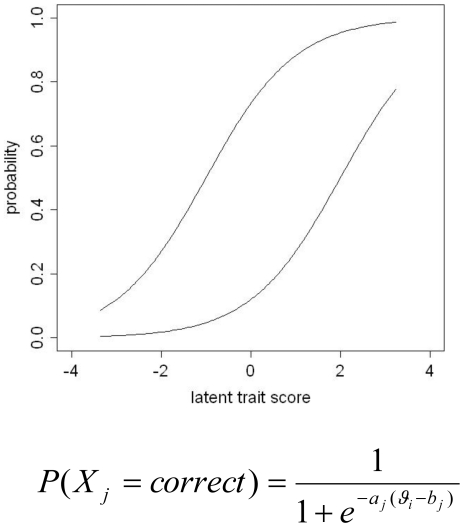
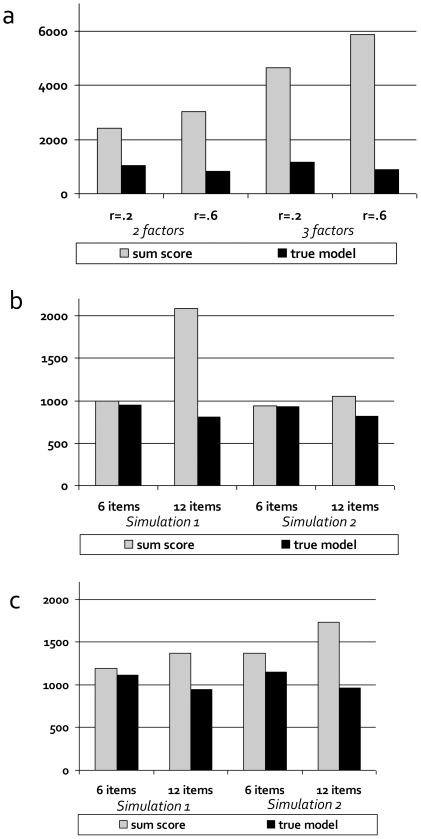
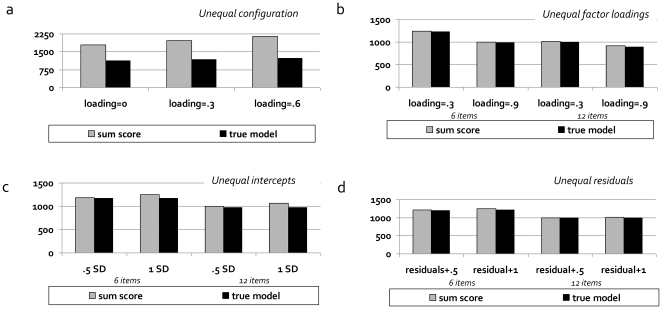
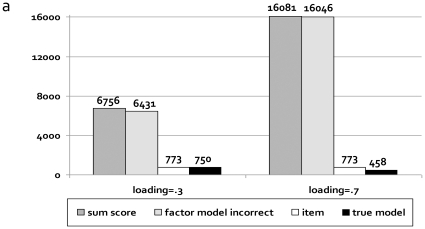
Methodology: We used comprehensive simulation studies to show that three phenotypic measurement issues also provide viable explanations of the missing heritability: phenotypic complexity, measurement bias, and phenotypic resolution. We identify the circumstances in which the use of phenotypic sum-scores and the presence of measurement bias lower the power to detect genetic variants. In addition, we show how the differential resolution of psychometric instruments (i.e., whether the instrument includes items that resolve individual differences in the normal range or in the clinical range of a phenotype) affects the power to detect genetic variants.
Conclusion: We conclude that careful phenotypic data modelling can improve the genetic signal, and thus the statistical power to identify genetic variants by 20-99%.
Conflict of interest statement
Figures
Similar articles
-
Heritability in the genome-wide association era.Hum Genet. 2012 Oct;131(10):1655-64. doi: 10.1007/s00439-012-1199-6. Epub 2012 Jul 21. Hum Genet. 2012. PMID: 22821350 Free PMC article. Review.
-
Methodology for the analysis of rare genetic variation in genome-wide association and re-sequencing studies of complex human traits.Brief Funct Genomics. 2014 Sep;13(5):362-70. doi: 10.1093/bfgp/elu012. Epub 2014 Jun 10. Brief Funct Genomics. 2014. PMID: 24916163 Free PMC article.
-
Measuring missing heritability: inferring the contribution of common variants.Proc Natl Acad Sci U S A. 2014 Dec 9;111(49):E5272-81. doi: 10.1073/pnas.1419064111. Epub 2014 Nov 24. Proc Natl Acad Sci U S A. 2014. PMID: 25422463 Free PMC article.
-
Elements of 'missing heritability'.Curr Opin Cardiol. 2012 May;27(3):197-201. doi: 10.1097/HCO.0b013e328352707d. Curr Opin Cardiol. 2012. PMID: 22450721 Review.
-
The overdue promise of short tandem repeat variation for heritability.Trends Genet. 2014 Nov;30(11):504-12. doi: 10.1016/j.tig.2014.07.008. Epub 2014 Aug 30. Trends Genet. 2014. PMID: 25182195 Free PMC article. Review.
Cited by
-
Grand challenge in behavioral and psychiatric genetics: quantitative challenges to keeping up with molecular advances.Front Genet. 2011 Mar 1;2:9. doi: 10.3389/fgene.2011.00009. eCollection 2011. Front Genet. 2011. PMID: 22303308 Free PMC article. No abstract available.
-
Alcohol-related genes show an enrichment of associations with a persistent externalizing factor.J Abnorm Psychol. 2016 Oct;125(7):933-945. doi: 10.1037/abn0000194. Epub 2016 Aug 8. J Abnorm Psychol. 2016. PMID: 27505405 Free PMC article.
-
Nordic OCD & Related Disorders Consortium: Rationale, design, and methods.Am J Med Genet B Neuropsychiatr Genet. 2020 Jan;183(1):38-50. doi: 10.1002/ajmg.b.32756. Epub 2019 Aug 19. Am J Med Genet B Neuropsychiatr Genet. 2020. PMID: 31424634 Free PMC article.
-
Impact of measurement error on testing genetic association with quantitative traits.PLoS One. 2014 Jan 24;9(1):e87044. doi: 10.1371/journal.pone.0087044. eCollection 2014. PLoS One. 2014. PMID: 24475218 Free PMC article.
-
Common SNPs explain some of the variation in the personality dimensions of neuroticism and extraversion.Transl Psychiatry. 2012 Apr 17;2(4):e102. doi: 10.1038/tp.2012.27. Transl Psychiatry. 2012. PMID: 22832902 Free PMC article.
References
-
- Li J, Coates RJ, Gwinn M, Khoury MJ. Steroid 5-α-Reductase Type 2 (SRD5a2) gene polymorphism and risk of prostate cancer: a HuGE review Human Genome. Epidemiology. 2010;171:1–13. - PubMed
-
- Peng B, Cao L, Wang W, Xian L, Jiang D, et al. Polymorphisms in the promotor region of matrix metalloproteinases 1 and 3 cancer risk: a meta-analysis of 50 case-control studies. Mutagenesis. 2010;25:41–48. - PubMed
-
- Tian Y, Li Y, Hu Z, Wang D, Sum X, et al. Differential effects of NOD2 polymorphisms on colorectal cancer risk: a meta-analysis. Int J Colorectal Dis. 2010;25:161–168. - PubMed
-
- Zhang HF, Qiu LX, Chen Y, Zu WL, Mao C, et al. ATG16L1 T300A polymorphism and Crohn's disease susceptibility: evidence from 13022 cases and 17532 controls. Hum Gen. 2009;125:627–631. - PubMed
Publication types
MeSH terms
LinkOut - more resources
Full Text Sources
