. 2010 Nov 10;5(11):e15425.
doi: 10.1371/journal.pone.0015425.

Induction of glucose metabolism in stimulated T lymphocytes is regulated by mitogen-activated protein kinase signaling

Affiliations

Induction of glucose metabolism in stimulated T lymphocytes is regulated by mitogen-activated protein kinase signaling

Aimee J Marko et al. PLoS One. .

Abstract

T lymphocytes play a critical role in cell-mediated immune responses. During activation, extracellular and intracellular signals alter T cell metabolism in order to meet the energetic and biosynthetic needs of a proliferating, active cell, but control of these phenomena is not well defined. Previous studies have demonstrated that signaling from the costimulatory receptor CD28 enhances glucose utilization via the phosphatidylinositol-3-kinase (PI3K) pathway. However, since CD28 ligation alone does not induce glucose metabolism in resting T cells, contributions from T cell receptor-initiated signaling pathways must also be important. We therefore investigated the role of mitogen-activated protein kinase (MAPK) signaling in the regulation of mouse T cell glucose metabolism. T cell stimulation strongly induces glucose uptake and glycolysis, both of which are severely impaired by inhibition of extracellular signal-regulated kinase (ERK), whereas p38 inhibition had a much smaller effect. Activation also induced hexokinase activity and expression in T cells, and both were similarly dependent on ERK signaling. Thus, the ERK signaling pathway cooperates with PI3K to induce glucose utilization in activated T cells, with hexokinase serving as a potential point for coordinated regulation.


Conflict of interest statement

Competing Interests: The authors have declared that no competing interests exist.

Figures

Figure 1
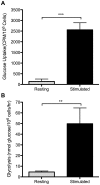
Figure 1. Activation induces an “aerobic glycolysis” phenotype in mouse T cells.
Purified T cells were cultured with either control hamster IgG (resting) or anti-CD3 plus anti-CD28 antibodies (stimulated). Glucose uptake (A) and glycolysis (B) rates were measured after 24 hours. ***p<0.0001, means are different; **, p<0.001, means are different. Results are representative of at least 3 independent experiments.
Figure 2
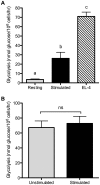
Figure 2. Lymphoma cells show constitutively high glycolysis.
(A) Glycolysis was measured in EL-4 lymphoma cells from continuous culture, without additional stimulation. Glycolysis in resting and stimulated T cells (as described in Figure 1) was measured for comparison. p<0.001, means that do not share a letter differ. (B) EL-4 cells were cultured for 24 hours with either control hamster IgG (unstimulated) or anti-CD3 plus anti-CD28 antibodies (stimulated) and glycolysis rates were measured. ns, not significantly different. Results are representative of 2 (A) or 3 (B) independent experiments.
Figure 3
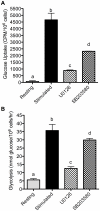
Figure 3. Glucose metabolism in T cells is regulated by MAPK signaling.
Purified T cells were stimulated in the absence or presence of the ERK inhibitor U0126 (2.6 µM) or the p38 inhibitor SB203580 (20 µM) for 24 hours. Glucose uptake (A) and glycolysis (B) were measured as in Figure 1. p<0.05, means that do not share a letter differ. Results are representative of 3 independent experiments.
Figure 4
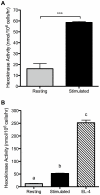
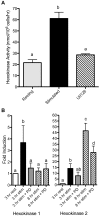
Figure 4. T cell activation induces hexokinase activity.
(A) Resting or 24-hour stimulated T cells were lysed in 0.1% Triton X-100 and enzymatic activity of hexokinase was measured. ***p<0.0001, means are different. (B) Continuously growing EL-4 cells were lysed in 0.1% Triton X-100 and hexokinase activity was compared to that in resting and 24-hour stimulated T cells. p<0.0001, means that do not share a letter differ. Results are representative of 3 (A) or 2 (B) independent experiments.
Figure 5
Figure 5. Hexokinase activity in activated T cells is regulated by MAPK signaling.
(A) T cells were stimulated in the absence or presence of the ERK inhibitor U0126 (2.6 µM), as in Figure 3, and hexokinase activity was measured. p<0.05, means that do not share a common letter differ. (B) T cells were cultured with control (rest) or anti-CD3 and anti-CD28 antibodies for the indicated times, in the absence (stim) or presence of 40 µM PD98059 (stim + PD). Hexokinase 1 (left panel) and hexokinase 2 (right panel) mRNA levels were determined by quantitative real-time PCR. p<0.05, means that do not share a common letter differ. Results are representative of 3 (hexokinase 1) or 2 (hexokinase 2) independent experiments.

Similar articles

Cited by

References

    1. Cooper EH, Barkhan P, Hale AJ. Observations on the Proliferation of Human Leucocytes Cultured with Phytohaemagglutinin. Brit J Haemat. 1963;9:101–111. - PubMed
    1. Hedeskov CJ. Early effects of phytohaemagglutinin on glucose metabolism of normal human lymphocytes. Biochem J. 1968;110:373–380. - PMC - PubMed
    1. Roos D, Loos JA. Changes in the carbohydrate metabolism of mitogenically stimulated human peripheral lymphocytes. I. Stimulation by phytohaemagglutinin. Biochim Biophys Acta. 1970;222:565–582. - PubMed
    1. Sagone AL, Jr, LoBuglio AF, Balcerzak SP. Alterations in hexose monophosphate shunt during lymphoblastic transformation. Cell Immunol. 1974;14:443–452. - PubMed
    1. Culvenor JG, Weidemann MJ. Phytohaemagglutinin stimulation of rat thymus lymphocytes glycolysis. Biochim Biophys Acta. 1976;437:354–363. - PubMed

Publication types

MeSH terms