

Chromosome driven spatial patterning of proteins in bacteria
- PMID: 21085680
- PMCID: PMC2978675
- DOI: 10.1371/journal.pcbi.1000986
Chromosome driven spatial patterning of proteins in bacteria
Abstract
The spatial patterning of proteins in bacteria plays an important role in many processes, from cell division to chemotaxis. In the asymmetrically dividing bacteria Caulobacter crescentus, a scaffolding protein, PopZ, localizes to both poles and aids the differential patterning of proteins between mother and daughter cells during division. Polar patterning of misfolded proteins in Escherichia coli has also been shown, and likely plays an important role in cellular ageing. Recent experiments on both of the above systems suggest that the presence of chromosome free regions along with protein multimerization may be a mechanism for driving the polar localization of proteins. We have developed a simple physical model for protein localization using only these two driving mechanisms. Our model reproduces all the observed patterns of PopZ and misfolded protein localization--from diffuse, unipolar, and bipolar patterns and can also account for the observed patterns in a variety of mutants. The model also suggests new experiments to further test the role of the chromosome in driving protein patterning, and whether such a mechanism is responsible for helping to drive the differentiation of the cell poles.
Conflict of interest statement
The authors have declared that no competing interests exist.
Figures
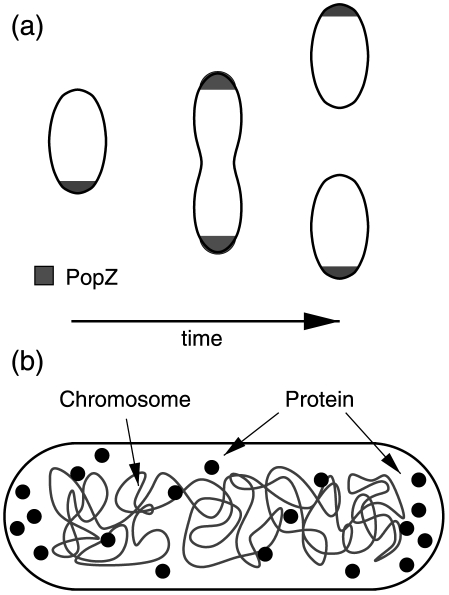
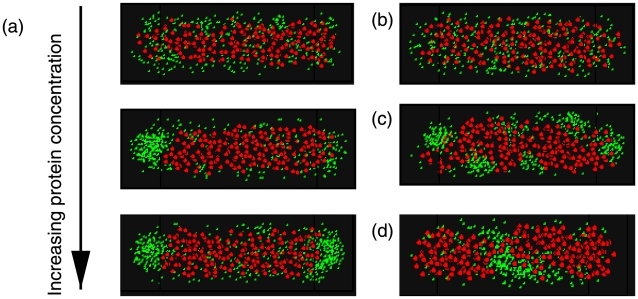
 ) to unipolar (middle,
  ), to bipolar (lower,
  ) as the concentration increases for fixed DNA volume fraction
  . In these figures, the diameter of DNA monomers is
  , the diameter of PopZ subunits is
  , the length of the cell is
  and the diameter is
  . (b) Decreasing the interaction between PopZ monomers, here
  , leads to freely diffusing protein monomers. (c) Increasing the protein-protein interaction,
  , causes protein to form multiple domains. (d) Effect of fragmenting the chromosome into 10 equal fragments. In all the above simulations the nucleoid was modeled using an attractive Lennard-Jones potential with
  .
.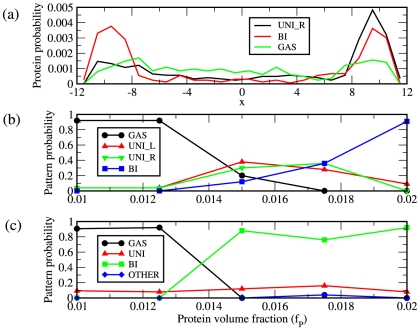
 measured in
  . Shown are the densities for diffuse (GAS), unipolar on the right (UNI_R) and bipolar (BI). (b) Shown are the resulting frequencies of protein patterns from 50 separate simulations at each value of
  for the cell geometry and DNA density described in Fig. 2a. (c) Same as in (b) except using a DNA volume fraction of
  . The frequencies of both unipolar patterns have been combined into a single unipolar classification, ‘UNI’ and patterns that result in domains elsewhere than at the poles are classified as ‘OTHER’.
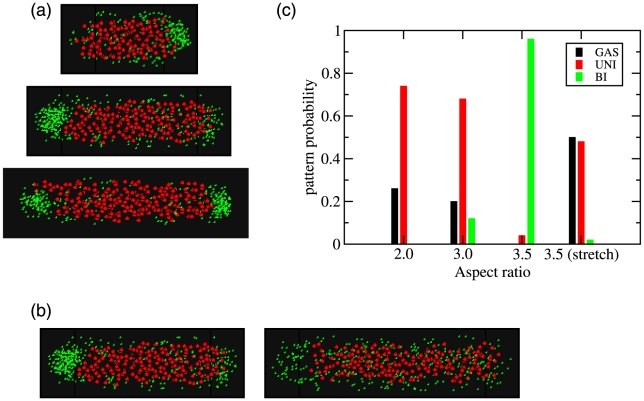
 and
and  with a cell diameter of
  . (top) Cell with
  and an aspect ratio of 2.0 and a typical unipolar pattern. (middle) Cell with
  and a aspect ratio of 3.0 showing a unipolar pattern. (bottom) Cell with
  , giving an aspect ratio of 3.5 showing the likely bipolar pattern. (b) Affect on patterning by altering cell shape. In (b) the total amount of protein and DNA are fixed using volume fractions are
  and
and  respectively for a cell with
  and a diameter of
  . (left) A cell with
  showing unipolar patterning. (right) A cell with
  showing a destabilization of the protein domain. For simulations in both (a) and (b) the nucleoid was modeled using an attractive Lennard-Jones potential with
  (c) Summary of results for the frequency of the various patterns over 50 simulations at each aspect ratio.
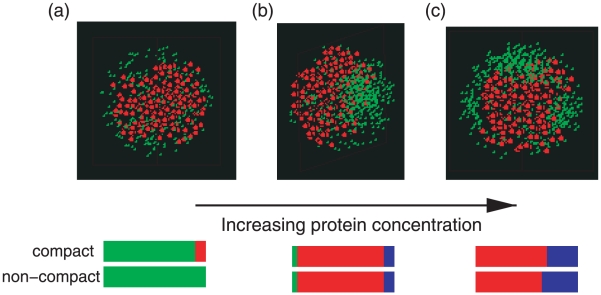
 to unispot (center),
  to multi-spot at higher concentrations (right),
  . The radius of the cell is
  , using
  and all other bead sizes and interactions are as given in Fig. 2. Beneath each pattern are shown the frequencies of observing the patterns: diffuse (green), unispot (red), bipolar (blue). Compact refers to a nucleoid modeled using an attractive Lennard-Jones potential with
  and non-compact is for a nucleoid with only the repulsive portion of the Lennard-Jones potential considered.
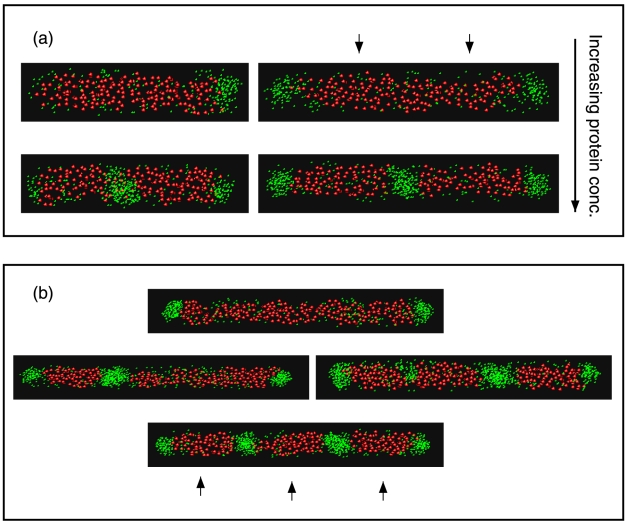
 with the length of a single cell having
  , using
  to determine the size of a single chromosome. Protein concentration increases from top to bottom, from
  (top) to
  (bottom), and cell's length is varied, from
  (left) to
  (right). (b) Cell containing three chromosomes using the same individual chromosome size as in (a), with a cell length of
  . At lower concentrations (
 ), protein forms only at poles (top). At higher protein concentrations,
  poles and interchromosomal regions can be occupied by protein domains (bottom) and at even higher concentrations (
 ) all chromosome free regions can be occupied by a protein domain.
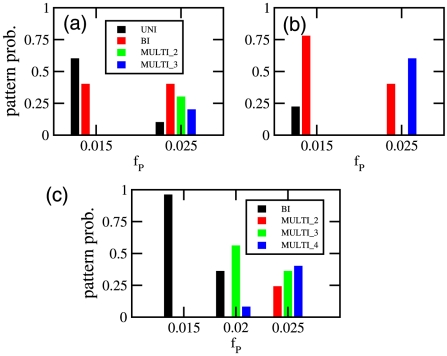
 or (b) length
  . Diameter and DNA volume fraction are as in Fig. 6a. ‘MULTI_2’ corresponds to 2 protein domains, one in between the two chromosomes and one at a pole. ‘MULTI_3’ corresponds to all chromosome free regions being occupied by a protein domain. (c) Results for cells possessing three chromosomes. Here ‘MULTI_2’ are patterns with two protein domains that are not at both poles, ‘MULTI_3’ cells possess three domains and ‘MULTI_4’ cells have all chromosome free regions occupied by a protein domain. Frequecencies of patterns were found as a function of
  over 25 independent simulations at each value of
  and length,
  .
.References
-
- Loose M, Fischer-Friedrich E, Ries J, Kruse K, Schwille P. Spatial regulators for bacterial cell division self-organize into surface waves in vitro. Science. 2008;320:789–792. - PubMed
-
- Howard M, Rutenberg A, de Vet S. Dynamic compartmentalization of bacteria: accurate division in e. coli. Phys Rev Lett. 2001;87:278102. - PubMed
Publication types
MeSH terms
Substances
LinkOut - more resources
Full Text Sources
