. 2010 Nov 11;5(11):e13932.
doi: 10.1371/journal.pone.0013932.

Phospholipase D family member 4, a transmembrane glycoprotein with no phospholipase D activity, expression in spleen and early postnatal microglia

Affiliations

Phospholipase D family member 4, a transmembrane glycoprotein with no phospholipase D activity, expression in spleen and early postnatal microglia

Fumio Yoshikawa et al. PLoS One. .

Abstract

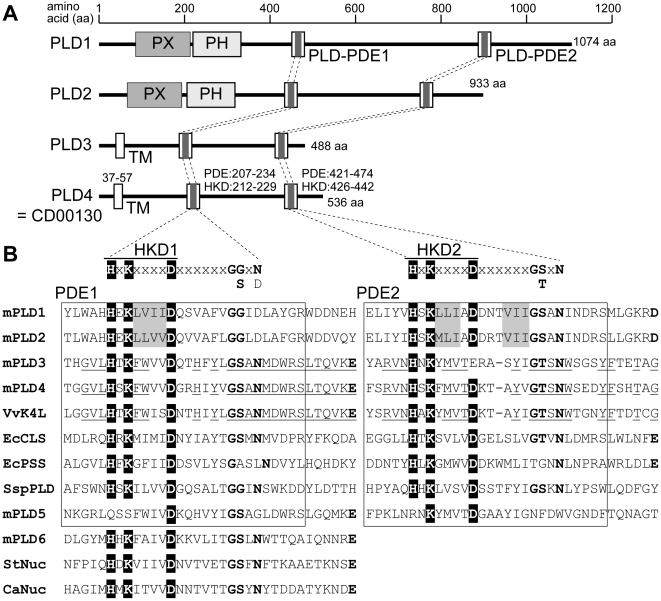
Background: Phospholipase D (PLD) catalyzes conversion of phosphatidylcholine into choline and phosphatidic acid, leading to a variety of intracellular signal transduction events. Two classical PLDs, PLD1 and PLD2, contain phosphatidylinositide-binding PX and PH domains and two conserved His-x-Lys-(x)(4)-Asp (HKD) motifs, which are critical for PLD activity. PLD4 officially belongs to the PLD family, because it possesses two HKD motifs. However, it lacks PX and PH domains and has a putative transmembrane domain instead. Nevertheless, little is known regarding expression, structure, and function of PLD4.

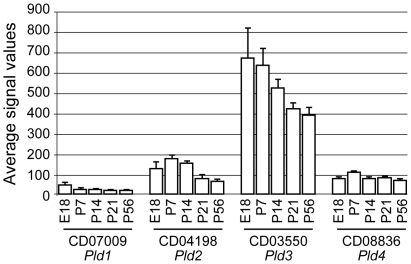
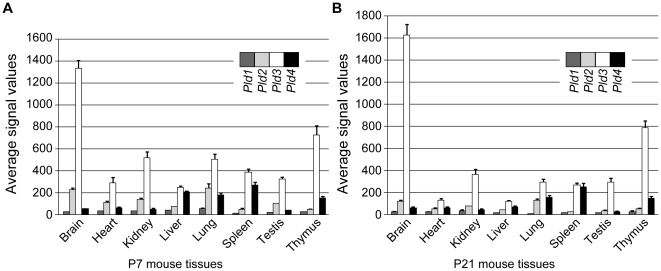
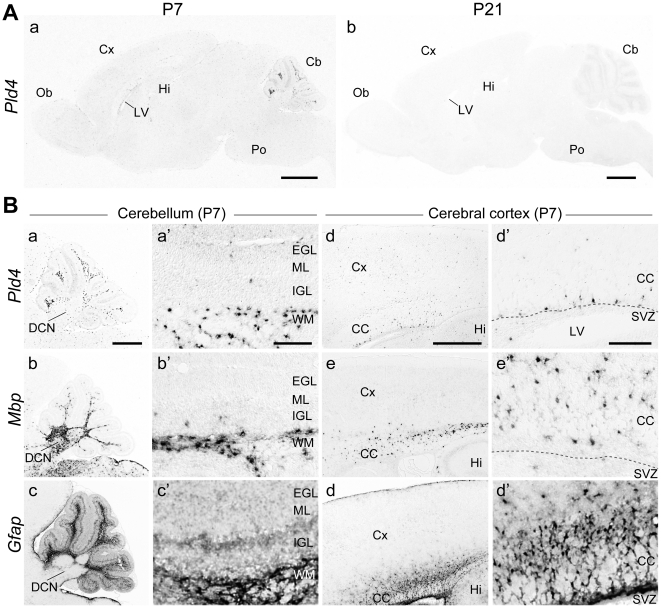
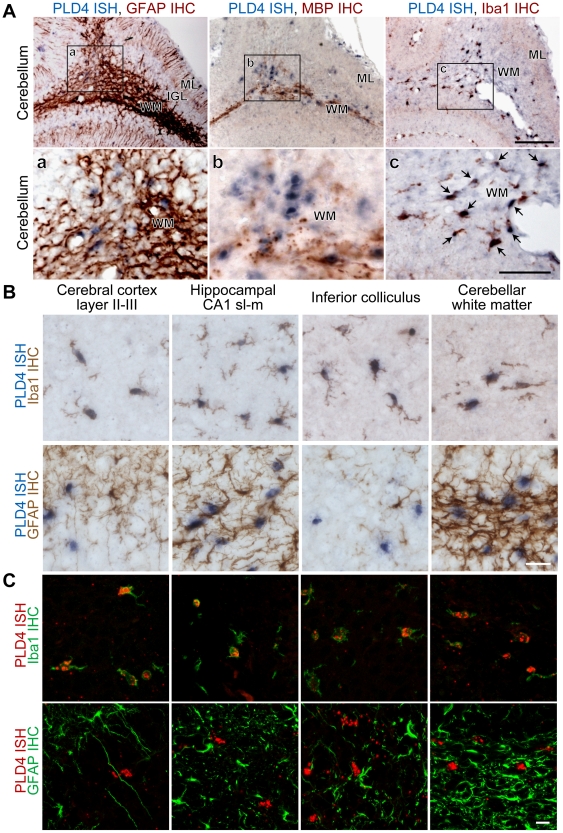
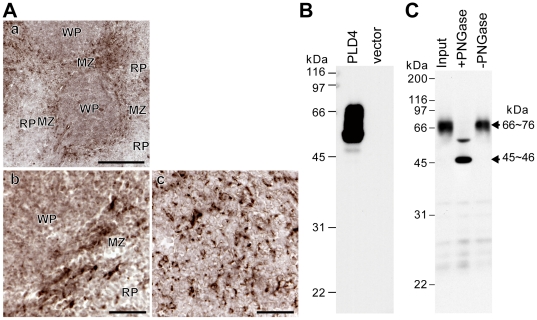
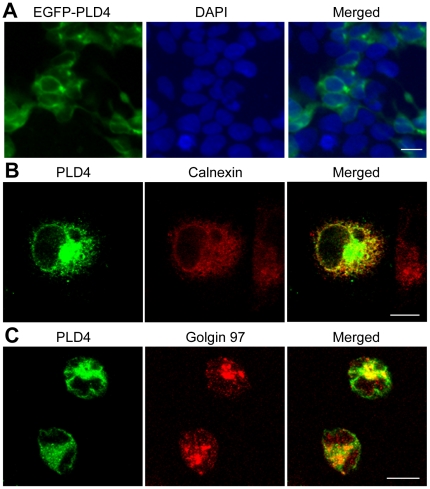
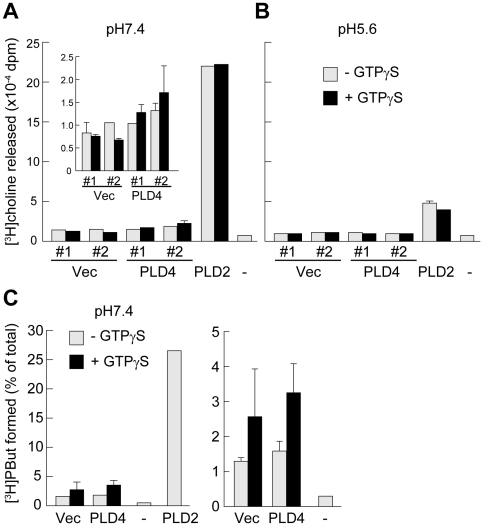
Methodology/principal findings: PLD4 was analyzed in terms of expression, structure, and function. Expression was analyzed in developing mouse brains and non-neuronal tissues using microarray, in situ hybridization, immunohistochemistry, and immunocytochemistry. Structure was evaluated using bioinformatics analysis of protein domains, biochemical analyses of transmembrane property, and enzymatic deglycosylation. PLD activity was examined by choline release and transphosphatidylation assays. Results demonstrated low to modest, but characteristic, PLD4 mRNA expression in a subset of cells preferentially localized around white matter regions, including the corpus callosum and cerebellar white matter, during the first postnatal week. These PLD4 mRNA-expressing cells were identified as Iba1-positive microglia. In non-neuronal tissues, PLD4 mRNA expression was widespread, but predominantly distributed in the spleen. Intense PLD4 expression was detected around the marginal zone of the splenic red pulp, and splenic PLD4 protein recovered from subcellular membrane fractions was highly N-glycosylated. PLD4 was heterologously expressed in cell lines and localized in the endoplasmic reticulum and Golgi apparatus. Moreover, heterologously expressed PLD4 proteins did not exhibit PLD enzymatic activity.

Conclusions/significance: Results showed that PLD4 is a non-PLD, HKD motif-carrying, transmembrane glycoprotein localized in the endoplasmic reticulum and Golgi apparatus. The spatiotemporally restricted expression patterns suggested that PLD4 might play a role in common function(s) among microglia during early postnatal brain development and splenic marginal zone cells.


Conflict of interest statement

Competing Interests: The authors have declared that no competing interests exist.

Figures

Figure 1
Figure 1. Structural comparisons of PLD superfamily members.
A, protein structures and domains of mouse PLD family members PLD1, PLD2, PLD3, PLD4 (CDT-DB ID = CD00130), PLD5, and PLD6. Top line represents amino acid (aa) position. PX, Phox homology domain; PH, pleckstrin homology domain; PLD-PDE1 and PLD-PDE2, PLD-phosphodiesterase domain 1 and 2, respectively; TM, transmembrane domain. B, amino-acid sequence alignment of the PLD-PDE domains containing conserved HKD motifs of PLD superfamily members. mPLD1–6, PLD1–6 of mice; VvK4L, K4L protein of Vaccinia virus; EcCLS, cardiolipin synthase of Escherichia coli; EcPSS, phosphatidylserine syntase of E. coli; SspPLD, PLD of Streptomyces sp. strain PMF; StNuc, nuclease of Salmonella typhimurium IncN plasmid; CaNuc, nuclease of Clostoridium acetobtylicum. The amino-acid sequences of two PDE domains (PDE1 and PDE2) containing the conserved His-x-Lys-x-x-x-x-D (where x is any amino acid) motif (HKD1–2, motif 1 and motif 2, respectively) are aligned. PDE1 and PDE2 domain sequences are surrounded by a frame. Conserved His (H), Lys (K), and Asp (D) residues are highlighted black. mPLD6, StNuc, and CaNuc contain only one HKD motif and the HKD-containing sequences are aligned with PDE1-HKD1 domains from other members. Conserved amino acid residues from the superfamily are in bold. Conserved hydrophobic patches in mPLD1 and mPLD2 are highlighted grey. Conserved amino acid residues of mPLD3, mPLD4, and VvK4L are underlined.
Figure 2
Figure 2. Temporal profiles of mouse PLD1–4 mRNA expression during the postnatal period.
Expression profiles of PLD1–4 (Pld1, CD07009; Pld2, CD04198; Pld3, CD03550; Pld4, CD08836 in the CDT-DB) mRNAs in mouse cerebella at E18, P7, P14, P21, and P56 were analyzed using GeneChip microarrays (Affymetrix MG 430 2.0 Array). Average values of normalized hybridization signals are presented. Error bars show standard error of the mean (SEM) from four independent experiments.
Figure 3
Figure 3. Tissue distribution of mouse PLD1–4 mRNA expression.
Expression profiles of PLD1–4 (Pld1, CD07009; Pld2, CD04198; Pld3, CD03550; Pld4, CD08836 in the CDT-DB) mRNAs in the brain, heart, kidney, liver, lung, spleen, testis, and thymus tissues of C57BL6/J mice at P7 (A) and P21 (B) were analyzed using GeneChip microarrays (Affymetrix MG 430A 2.0 Array). Average values of normalized hybridization signals are indicated (mean ± SEM, n = 3).
Figure 4
Figure 4. Spatial cellular profiles of PLD4 mRNA expression in mouse brains as determined by in situ hybridization.
A, distribution of PLD4 mRNA in sagittal sections of mouse brains at P7 (a) and P21 (b). Scale bars = 1 mm. B, images of cerebellum (panels a–c and a'–c') and cerebral cortex (panels d–f and d'–f') expressing PLD4, MBP, and GFAP mRNAs at P7. Regions of mRNA signals in panels a–f are magnified in panels a'–f', respectively. Cb, cerebellum; CC, corpus callosum; Cx, cerebral cortex; DCN, deep cerebellar nuclei; EGL, external granular layer; Hi, hippocampus; IGL, internal granular layer; LV, lateral ventricle; ML, molecular layer; Ob, olfactory bulb; Po, pons; SVZ, subventricular zone; WM, white matter. Scale bars = 500 µm in a; 100 µm in a', d and d'.
Figure 5
Figure 5. Mouse PLD4 mRNA expression is localized in white matter microglia of early postnatal brains.
A, Double labeling analysis of mouse cerebellar sections using in situ hybridization (ISH) of PLD4 mRNA and immunohistochemistry (IHC) with glial cell marker proteins. PLD4 mRNA (dark blue color) and protein (brown color) for GFAP (astrocyte marker) (left panel), MBP (oligodendrocyte marker) (middle panel), or Iba1 (microglia marker) (right panel) are simultaneously detected around the white matter region of the mouse cerebellum at P7. Panels a, b, and c show enlarged images of the frame indicated in the top panels. B and C, double labeling of layer II–III in the cerebral cortex, the stratum-lacunosum-moleculare (sl-m) of the hippocampal CA1 region, inferior colliculus, and cerebellar white matter by ISH for PLD4 mRNA and IHC (green) for Iba1 or GFAP. Conventional NBT/BCIP chromagen detection (dark blue) in B and HNPP/Fast Red fluorescent detection (red) in C were used. ISH signals for PLD4 mRNA are merged with IHC signals for Iba1 protein in these brain regions. WM, white matter; IGL, internal granular layer; ML, molecular layer. Scale bars = 100 µm and 50 µm in top and bottom of panel A, respectively; 20 µm in B and 10 µm in C.
Figure 6
Figure 6. PLD4 protein expression and glycosylation.
A, Mouse PLD4 protein expression is observed in cells within the red pulp, and largely around the marginal zone, of adult spleens. Immunohistochemical labeling of adult mouse spleen sections with anti-PLD4 antibody. PLD4 immunolabels are largely detected in splenic marginal zone cells within the red pulp. MZ, marginal zone; RP, red pulp; WP, white pulp. Scale bars = 500 µm. B, Western blot analysis of PLD4 proteins exogenously expressed in COS7 cells using an anti-PLD4 antibody. PLD4 and vector represent protein lysates of cells transfected with pcDNA3-PLD4 and pcDNA3 vector alone, respectively. C, Deglycosylation of endogenous PLD4 proteins in the mouse spleen membrane fraction by N-glycosidase-F (PNGase) digestion. Input, protein samples before treatment; +PNGase and -PNGase, treated with and without PNGase, respectively. The major immunoreactive bands of approximately 45∼46 kDa and 66∼76 kDa after treatment with and without PNGase, respectively, are indicated with arrows. Left, sizes in kDa of molecular weight markers.
Figure 7
Figure 7. Intracellular localization of PLD4 protein exogenously expressed in cultured cell lines.
A, EGFP fluorescent imaging (green) and DAPI nuclear staining (blue) of HEK293 cells transfected with pEGFP-PLD4. PLD4 is localized in a meshwork-like structure and around the periphery of nuclei. B and C, immunocytochemical localization of PLD4 protein (green) and either calnexin, an ER marker (red) (B) or golgin 97, a trans-Golgi marker (red) (C), in HeLa cells transfected with pcDNA3-PLD4. PLD4 is colocalized with calnexin in the ER and with golgin 97 in the Golgi complex. Scale bars = 10 µm.
Figure 8
Figure 8. PLD activity assay of PLD4 expression in HEK293 cells.
A–B, [3H]choline release activity in HEK293 cells transfected with PLD4, PLD2, or pcDNA3 vector alone (Vec) or non-transfected cells (−), in the presence or absence of GTPγS at pH 7.4 (A) or pH 5.2 (B). The inset in A shows the same data for vector (Vec)-transfected and PLD4-transfected cells on a different scale. Data from two independent experiments (#1 and #2, n = 3) are shown for PLD4 and Vec. C, Transphosphatidylation activity of HEK293 cells transfected with PLD4, PLD2, or vector alone (Vec), or non-transfected cells (−), in the presence or absence of GTPγS. The right graph shows the same data for Vec, PLD4, and – on a different scale.

Similar articles

Cited by

References

    1. Cockcroft S. Signalling roles of mammalian phospholipase D1 and D2. Cell Mol Life Sci. 2001;58:1674–1687. - PMC - PubMed
    1. Exton JH. Regulation of phospholipase D. FEBS Lett. 2002;531:58–61. - PubMed
    1. Jenkins GM, Frohman MA. Phospholipase D: a lipid centric review. Cell Mol Life Sci. 2005;62:2305–2316. - PMC - PubMed
    1. Aoki J, Inoue A, Okudaira S. Two pathways for lysophosphatidic acid production. Biochim Biophys Acta. 2008;1781:513–518. - PubMed
    1. Roth MG. Molecular mechanisms of PLD function in membrane traffic. Traffic. 2008;9:1233–1239. - PubMed

Publication types

MeSH terms