. 2010 Nov 9;8(11):e1000538.
doi: 10.1371/journal.pbio.1000538.

Quantitative control of organ shape by combinatorial gene activity

Affiliations

Quantitative control of organ shape by combinatorial gene activity

Min-Long Cui et al. PLoS Biol. .

Abstract

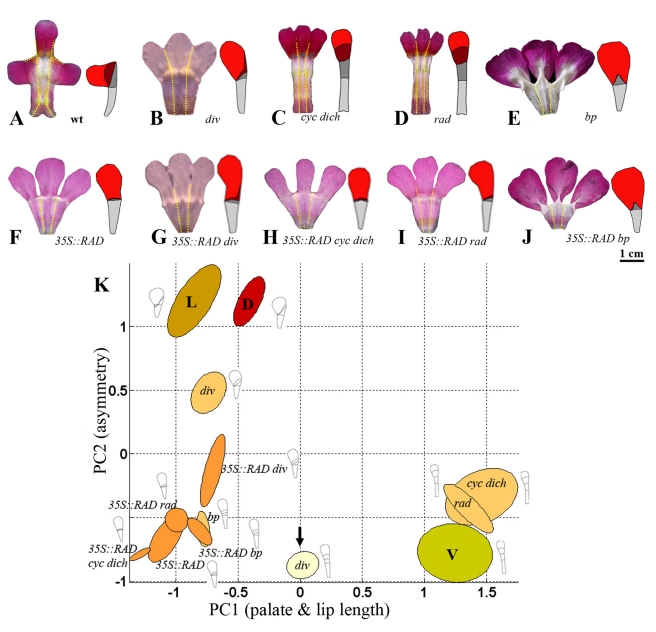
The development of organs with particular shapes, like wings or flowers, depends on regional activity of transcription factors and signalling molecules. However, the mechanisms that link these molecular activities to the morphogenetic events underlying shape are poorly understood. Here we describe a combination of experimental and computational approaches that address this problem, applying them to a group of genes controlling flower shape in the Snapdragon (Antirrhinum). Four transcription factors are known to play a key role in the control of floral shape and asymmetry in Snapdragon. We use quantitative shape analysis of mutants for these factors to define principal components underlying flower shape variation. We show that each transcription factor has a specific effect on the shape and size of regions within the flower, shifting the position of the flower in shape space. These shifts are further analysed by generating double mutants and lines that express some of the genes ectopically. By integrating these observations with known gene expression patterns and interactions, we arrive at a combinatorial scheme for how regional effects on shape are genetically controlled. We evaluate our scheme by incorporating the proposed interactions into a generative model, where the developing flower is treated as a material sheet that grows according to how genes modify local polarities and growth rates. The petal shapes generated by the model show a good quantitative match with those observed experimentally for each petal in numerous genotypes, thus validating the hypothesised scheme. This article therefore shows how complex shapes can be accounted for by combinatorial effects of transcription factors on regional growth properties. This finding has implications not only for how shapes develop but also for how they may have evolved through tinkering with transcription factors and their targets.


Conflict of interest statement

The authors have declared that no competing interests exist.

Figures

Figure 1
Figure 1. Flower shape of wild-type Antirrhinum majus.
(A–H) Whole flowers in face view (A,E), dorsal view (B,F), side view (C,G), and ventral view (D,H). (I–L) Flattened petals. Upper corolla section (I) with individual dorsal petal highlighted (J), and lower corolla section (K) with individual lateral and ventral petal highlighted (L). United regions of petals are shown with yellow dotted lines. For (J) and (L) primary landmarks are in green, secondary landmarks in yellow. dor, dorsal; lat, lateral; ven, ventral.
Figure 2
Figure 2. Shape analysis of wild-type petals.
(A) Effect on petal shape of varying PCs 1–4. Petal regions colour-coded as in Figure 1. The mean shape, corresponding to all PCs having a value of 0, is shown centrally. The shapes on either side illustrate the effect of increasing or reducing the values of each PC by one standard deviation. (B) Reconstruction of dorsal, lateral, and ventral petals with different numbers of PCs. The values for each PC are shown in brackets. (C) Locations of dorsal (D, red), lateral (L, orange), and ventral (V, yellow) petals in DV space. Position of mean petal shown with green dot. Diagrams show mean shapes for each petal type reconstructed using PC1 and PC2 values. Units for the axes are in standard deviations from the mean.
Figure 3
Figure 3. Analysis of ventral petals for various genotypes.
(A–J) Flattened lower corolla section with mean ventral petal shape on the right for the wild type (wt) and a series of other genotypes. Petal regions colour-coded as in Figure 1. (K) Positions of ventral petals of single mutants (all pale yellow) and 35S::RAD (bright yellow) projected onto DV space (from Figure 2C). (L) Positions of ventral petals of 35S::RAD in various genetic backgrounds (all bright yellow). Arrow points to ground state (div ventral petal). Positions of wild-type dorsal (D, red), lateral (L, orange), and ventral (V, dull yellow) petals shown for reference. Diagrams show mean shapes for each petal type reconstructed using PC1 and PC2 values. Units for the axes are in standard deviations from the mean. bp, backpetals.
Figure 4
Figure 4. Effect of ectopic RAD expression in Antirrhinum majus.
Comparison between wild-type (A,B) and 35S::RAD (C,D) flowers. Face views on left (A,C), side views on right (B,D). Scale bar  = 1 cm.
Figure 5
Figure 5. Analysis of dorsal petals for various genotypes.
(A–J) Flattened upper corolla sections with mean dorsal petal shape to the right for wild type (wt) and a series of other genotypes. Petal regions colour-coded as in Figure 1. (K) Positions of dorsal petals of various genotypes (colour-coded red or pink) projected onto DV space. Arrow points to ground state (div ventral petal, pale yellow). Positions of wild-type dorsal (D, red), lateral (L, orange), and ventral (V, dull yellow) shown for reference. Diagrams show mean shapes for each petal type reconstructed using PC1 and PC2 values. Units for the axes are in standard deviations from the mean. bp, backpetals.
Figure 6
Figure 6. Analysis of lateral petals for various genotypes.
(A–J) Flattened upper corolla sections with mean lateral petal shape for wild type (wt) and a series of other genotypes. Petal regions colour-coded as in Figure 1. (K) Positions of lateral petals of various genotypes (colour-coded orange) projected onto DV space. Arrow points to ground state (div ventral petal, pale yellow). Positions of wild-type dorsal (D, red), lateral (L, orange), and ventral (V, dull yellow) shown for reference. Diagrams show mean shapes for each petal type reconstructed using PC1 and PC2 values. Units for the axes are in standard deviations from the mean. bp, backpetals.
Figure 7
Figure 7. Combinatorial effects of dorsoventral genes.
In the following summaries of gene interactions, a dot (•) indicates “in combination with” while a tilda (∼) indicates “in the absence of.” (A) Ground state (div ventral petal). The basic petal shape is determined by gene activities that vary along the proximodistal (PTB, PLT, LIP, and DTL) and mediolateral (MED and LAT) axes. (B) Wild-type ventral petal. DIV is expressed throughout the petal. DIV reduces petal width while DIV•PLT increases palate length. DIV•RIM promotes bending back of the lobe (dotted line). (C) Wild-type lateral petal. Non-autonomous RAD activity from the dorsal side restricts DIV activity towards the ventral side at later stages of development. RAD•LIP and RAD•PLT reduce palate and lip length on one side while DIV•PLT increases palate length on the other. The lobe is bent back by DIV•RIM (at early stages, when DIV is expressed throughout the petal). (D) Wild-type dorsal petal. CYC and RAD are expressed throughout while DICH is expressed in the most dorsal half. CYC increases petal width. CYC•PLT and DICH•PLT increase palate length, while reduction in length by RAD•PLT is antagonised by DICH and CYC∼LAT. Reduction in lip length by RAD•LIP is antagonised by DICH•LAT, leading to a visible lip on the dorsal side. CYC•DTL increases length of the distal lobe, which is antagonised by DICH on the dorsal side.
Figure 8
Figure 8. Comparison of observed corolla shapes with growth model corolla shapes.
(A) Model corolla at initial developmental stage. (B) Initial model stage at same scale as (C). (C) Side view of wild-type corolla generated by growth model. (D) Ventral view of wild-type flower generated by growth model. (E) Ventral view of real flower. (F) Computationally flattened dorsal (d), lateral (l), and ventral (v) petals from the growth model. Petal regions colour-coded as in Figure 1. (G–O) Ventral view of mutants described in this article, with real flower on left and result from growth model on right. (P–S) Correlation between PC values for petals of observed and modelled petals. Each point represents the PC value obtained from the model for a particular petal type and genotype, plotted against the observed mean PC value for the corresponding petal and genotype.

References

    1. Held L. I. UK: Cambridge University Press; 2002. Imaginal discs: the genetic and cellular logic of pattern formation:
    1. Dworkin I, Gibson G. Epidermal growth factor receptor and transforming growth factor-beta signaling contributes to variation for wing shape in Drosophila melanogaster. Genetics. 2006;173:1417–1431. - PMC - PubMed
    1. Hejnowicz Z, Romberger J. A. Growth tensor of plant organs. Journal of Theoretical Biology. 1984;110:93–114.
    1. Sinnott E. New York: McGraw-Hill; 1960. Plant morphogenesis:
    1. Galego L, Almeida J. Role of DIVARICATA in the control of dorsoventral asymmetry in Antirrhinum flowers. Genes and Development. 2002;16:880–891. - PMC - PubMed

Publication types