

Mapping reliability in multicenter MRI: voxel-based morphometry and cortical thickness
- PMID: 21086550
- PMCID: PMC6870904
- DOI: 10.1002/hbm.20991
Mapping reliability in multicenter MRI: voxel-based morphometry and cortical thickness
Abstract
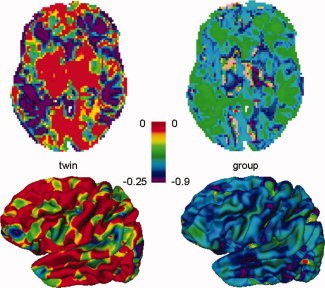
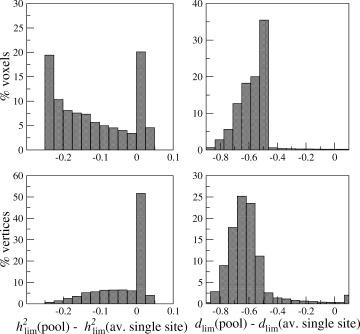
Multicenter structural MRI studies can have greater statistical power than single-center studies. However, across-center differences in contrast sensitivity, spatial uniformity, etc., may lead to tissue classification or image registration differences that could reduce or wholly offset the enhanced statistical power of multicenter data. Prior work has validated volumetric multicenter MRI, but robust methods for assessing reliability and power of multisite analyses with voxel-based morphometry (VBM) and cortical thickness measurement (CORT) are not yet available. We developed quantitative methods to investigate the reproducibility of VBM and CORT to detect group differences and estimate heritability when MRI scans from different scanners running different acquisition protocols in a multicenter setup are included. The method produces brain maps displaying information such as lowest detectable effect size (or heritability) and effective number of subjects in the multicenter study. We applied the method to a five-site multicenter calibration study using scanners from four different manufacturers, running different acquisition protocols. The reliability maps showed an overall good comparability between the sites, providing a reasonable gain in sensitivity in most parts of the brain. In large parts of the cerebrum and cortex scan pooling improved heritability estimates, with "effective-N" values upto the theoretical maximum. For some areas, "optimal-pool" maps indicated that leaving out a site would give better results. The reliability maps also reveal which brain regions are in any case difficult to measure reliably (e.g., around the thalamus). These tools will facilitate the design and analysis of multisite VBM and CORT studies for detecting group differences and estimating heritability.
Copyright © 2010 Wiley-Liss, Inc.
Figures
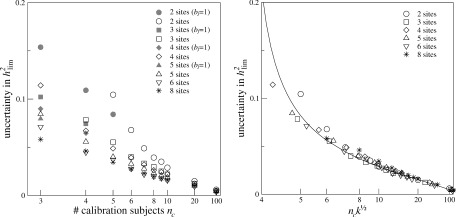
 = 160 for all values of k. The uncertainty was determined in a simulation experiment as the mean absolute difference between the experimentally determined values and the true, i.e., simulated, values of h
. The gray‐area symbols represent uncertainties in h
for which b
j = 1 was set; they are only displayed if the uncertainty was smaller than those obtained with free b
j (for the same n
c; same symbol shape). Right: scaled uncertainties of h
. The uncertainties turn out to follow the same curve (drawn line) after scaling of n
c and k: Uncertainty ≈ 0.098(n
c√k − 3.69)−2/3.
= 160 for all values of k. The uncertainty was determined in a simulation experiment as the mean absolute difference between the experimentally determined values and the true, i.e., simulated, values of h
. The gray‐area symbols represent uncertainties in h
for which b
j = 1 was set; they are only displayed if the uncertainty was smaller than those obtained with free b
j (for the same n
c; same symbol shape). Right: scaled uncertainties of h
. The uncertainties turn out to follow the same curve (drawn line) after scaling of n
c and k: Uncertainty ≈ 0.098(n
c√k − 3.69)−2/3.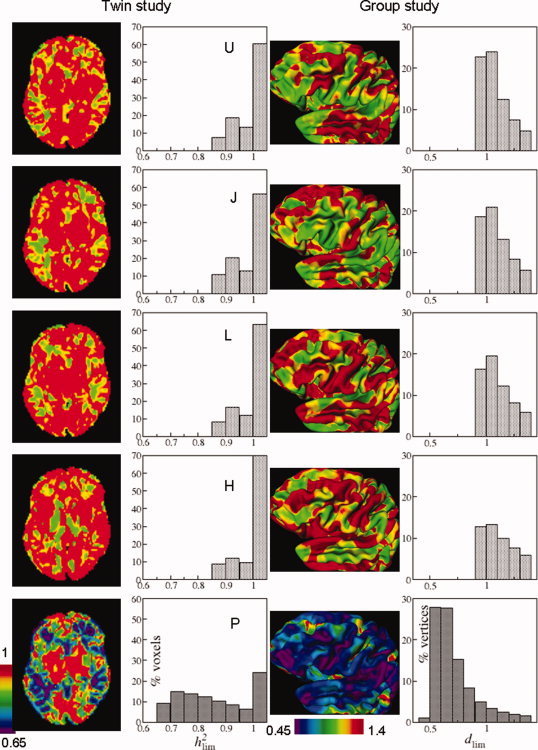
References
-
- Ashburner J, Friston KJ ( 2000): Voxel‐based morphometry—The methods. Neuroimage 11: 805–821. - PubMed
-
- Clark KA, Woods RP, Rottenberg DA, Toga AW, Mazziotta JC ( 2006): Impact of acquisition protocols and processing streams on tissue segmentation of T1 weighted MR images. Neuroimage 29: 185–202. - PubMed
-
- Chung M, Taylor J ( 2004): Diffusion smoothing on brain surface via finite element method. Biomedical Imaging: Macro to Nano. IEEE Int Symp 1: 432–435
-
- Collins DL, Holmes CJ, Peters TM, Evans AC ( 1995): Automatic 3‐D model‐based neuroanatomical segmentation. Hum Brain Mapp 3: 190–208.
-
- Ewers M, Teipel SJ, Dietrich O, Schoenberg SO, Jessen F, Heun R, Scheltens P, van de Pol L, Freymann NR, Moeller H‐J, Hampel H ( 2006): Multicenter assessment of reliability of cranial MRI. Neurobiol Aging 27: 1051–1059. - PubMed
Publication types
MeSH terms
Grants and funding
LinkOut - more resources
Full Text Sources
Medical
