Difference in gene duplicability may explain the difference in overall structure of protein-protein interaction networks among eukaryotes
- PMID: 21087510
- PMCID: PMC2994879
- DOI: 10.1186/1471-2148-10-358
Difference in gene duplicability may explain the difference in overall structure of protein-protein interaction networks among eukaryotes
Abstract
Background: A protein-protein interaction network (PIN) was suggested to be a disassortative network, in which interactions between high- and low-degree nodes are favored while hub-hub interactions are suppressed. It was postulated that a disassortative structure minimizes unfavorable cross-talks between different hub-centric functional modules and was positively selected in evolution. However, by re-examining yeast PIN data, several researchers reported that the disassortative structure observed in a PIN might be an experimental artifact. Therefore, the existence of a disassortative structure and its possible evolutionary mechanism remains unclear.
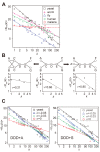
Results: In this study, we investigated PINs from the yeast, worm, fly, human, and malaria parasite including four different yeast PIN datasets. The analyses showed that the yeast, worm, fly, and human PINs are disassortative while the malaria parasite PIN is not. By conducting simulation studies on the basis of a duplication-divergence model, we demonstrated that a preferential duplication of low- and high-degree nodes can generate disassortative and non-disassortative networks, respectively. From this observation, we hypothesized that the difference in degree dependence on gene duplications accounts for the difference in assortativity of PINs among species. Comparison of 55 proteomes in eukaryotes revealed that genes with lower degrees showed higher gene duplicabilities in the yeast, worm, and fly, while high-degree genes tend to have high duplicabilities in the malaria parasite, supporting the above hypothesis.
Conclusions: These results suggest that disassortative structures observed in PINs are merely a byproduct of preferential duplications of low-degree genes, which might be caused by an organism's living environment.
Figures


Similar articles
-
Modification of gene duplicability during the evolution of protein interaction network.PLoS Comput Biol. 2011 Apr;7(4):e1002029. doi: 10.1371/journal.pcbi.1002029. Epub 2011 Apr 7. PLoS Comput Biol. 2011. PMID: 21490719 Free PMC article.
-
Preferential duplication in the sparse part of yeast protein interaction network.Mol Biol Evol. 2006 Dec;23(12):2467-73. doi: 10.1093/molbev/msl121. Epub 2006 Sep 15. Mol Biol Evol. 2006. PMID: 16980576
-
Analysis of the human protein interactome and comparison with yeast, worm and fly interaction datasets.Nat Genet. 2006 Mar;38(3):285-93. doi: 10.1038/ng1747. Nat Genet. 2006. PMID: 16501559
-
Birth and death of duplicated genes in completely sequenced eukaryotes.Trends Genet. 2001 May;17(5):237-9. doi: 10.1016/s0168-9525(01)02243-0. Trends Genet. 2001. PMID: 11335019 Review.
-
Reconstruction and Application of Protein-Protein Interaction Network.Int J Mol Sci. 2016 Jun 8;17(6):907. doi: 10.3390/ijms17060907. Int J Mol Sci. 2016. PMID: 27338356 Free PMC article. Review.
Cited by
-
Revealing the mystery of metabolic adaptations using a genome scale model of Leishmania infantum.Sci Rep. 2017 Aug 31;7(1):10262. doi: 10.1038/s41598-017-10743-x. Sci Rep. 2017. PMID: 28860532 Free PMC article.
-
Towards a Dynamic Interaction Network of Life to unify and expand the evolutionary theory.BMC Biol. 2018 May 29;16(1):56. doi: 10.1186/s12915-018-0531-6. BMC Biol. 2018. PMID: 29843714 Free PMC article. Review.
-
Structure-Based Modeling of the Gut Bacteria-Host Interactome Through Statistical Analysis of Domain-Domain Associations Using Machine Learning.BioTech (Basel). 2025 Feb 25;14(1):13. doi: 10.3390/biotech14010013. BioTech (Basel). 2025. PMID: 40227324 Free PMC article.
-
Relationship between gene duplicability and diversifiability in the topology of biochemical networks.BMC Genomics. 2014 Jul 8;15(1):577. doi: 10.1186/1471-2164-15-577. BMC Genomics. 2014. PMID: 25005725 Free PMC article.
References
-
- Uetz P, Giot L, Cagney G, Mansfield TA, Judson RS, Knight JR, Lockshon D, Narayan V, Srinivasan M, Pochart P, Qureshi-Emili A, Li Y, Godwin B, Conover D, Kalbfleisch T, Vijayadamodar G, Yang M, Johnston M, Fields S, Rothberg JM. A comprehensive analysis of protein-protein interactions in Saccharomyces cerevisiae. Nature. 2000;403:623–627. doi: 10.1038/35001009. - DOI - PubMed
-
- Yu H, Braun P, Yildirim MA, Lemmens I, Venkatesan K, Sahalie J, Hirozane-Kishikawa T, Gebreab F, Li N, Simonis N, Hao T, Rual JF, Dricot A, Vazquez A, Murray RR, Simon C, Tardivo L, Tam S, Svrzikapa N, Fan C, de Smet AS, Motyl A, Hudson ME, Park J, Xin X, Cusick ME, Moore T, Boone C, Snyder M, Roth FP, Barabási AL, Tavernier J, Hill DE, Vidal M. High-quality binary protein interaction map of the yeast interactome network. Science. 2008;322:104–110. doi: 10.1126/science.1158684. - DOI - PMC - PubMed
-
- Li S, Armstrong CM, Bertin N, Ge H, Milstein S, Boxem M, Vidalain PO, Han JD, Chesneau A, Hao T, Goldberg DS, Li N, Martinez M, Rual JF, Lamesch P, Xu L, Tewari M, Wong SL, Zhang LV, Berriz GF, Jacotot L, Vaglio P, Reboul J, Hirozane-Kishikawa T, Li Q, Gabel HW, Elewa A, Baumgartner B, Rose DJ, Yu H, Bosak S, Sequerra R, Fraser A, Mango SE, Saxton WM, Strome S, Van Den Heuvel S, Piano F, Vandenhaute J, Sardet C, Gerstein M, Doucette-Stamm L, Gunsalus KC, Harper JW, Cusick ME, Roth FP, Hill DE, Vidal M. A map of the interactome network of the metazoan C. elegans. Science. 2004;303:540–543. doi: 10.1126/science.1091403. - DOI - PMC - PubMed
Publication types
MeSH terms
Substances
LinkOut - more resources
Full Text Sources
Molecular Biology Databases

