. 2010 Nov 19:9:75.
doi: 10.1186/1475-925X-9-75.

Scale-adaptive surface modeling of vascular structures

Affiliations

Scale-adaptive surface modeling of vascular structures

Jianhuang Wu et al. Biomed Eng Online. .

Abstract

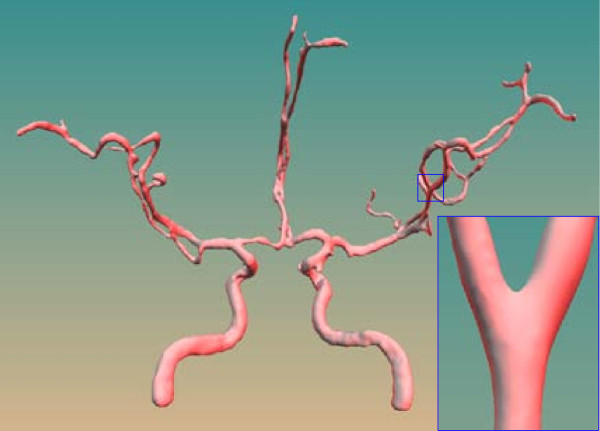
Background: The effective geometric modeling of vascular structures is crucial for diagnosis, therapy planning and medical education. These applications require good balance with respect to surface smoothness, surface accuracy, triangle quality and surface size.

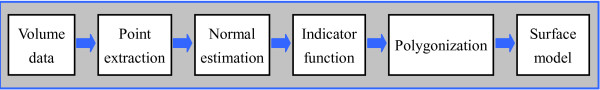
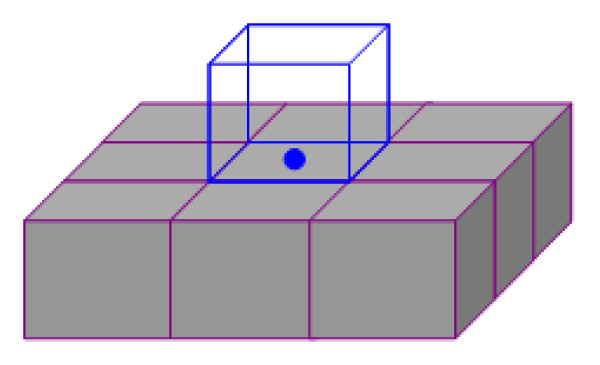
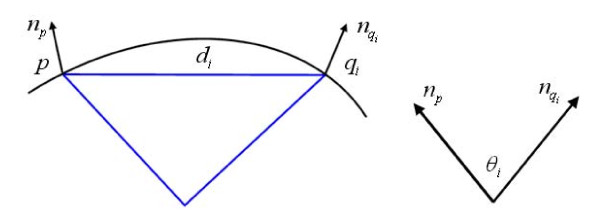
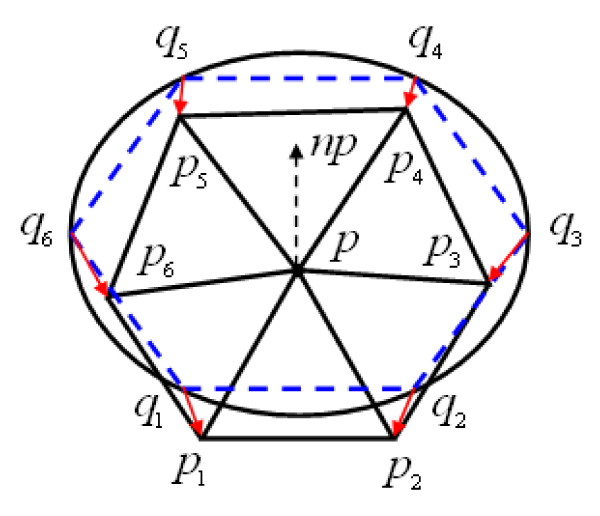
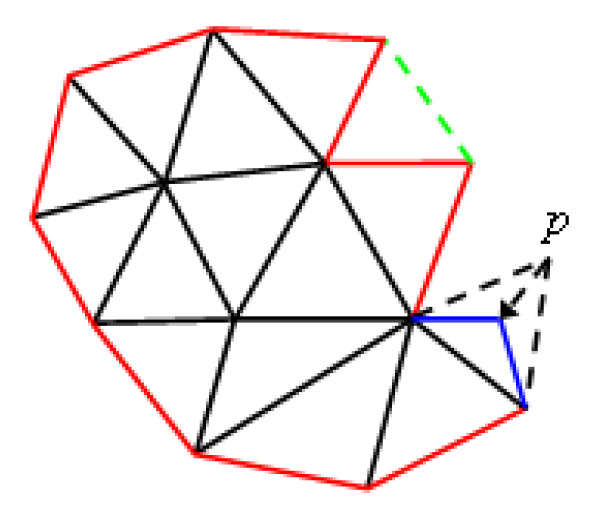
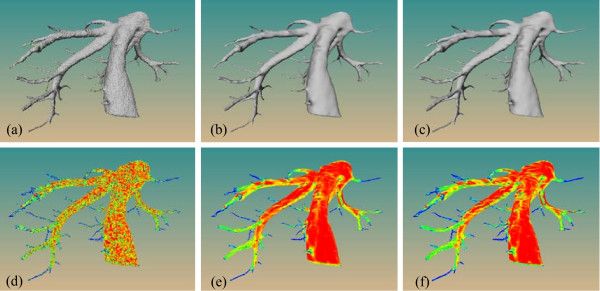
Methods: Our method first extracts the vascular boundary voxels from the segmentation result, and utilizes these voxels to build a three-dimensional (3D) point cloud whose normal vectors are estimated via covariance analysis. Then a 3D implicit indicator function is computed from the oriented 3D point cloud by solving a Poisson equation. Finally the vessel surface is generated by a proposed adaptive polygonization algorithm for explicit 3D visualization.

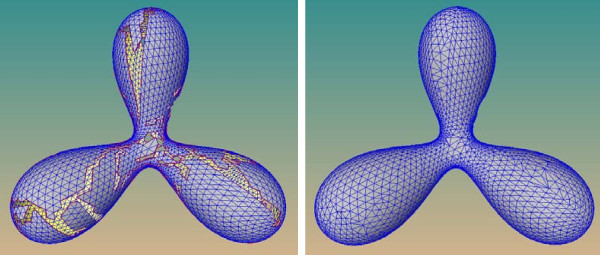
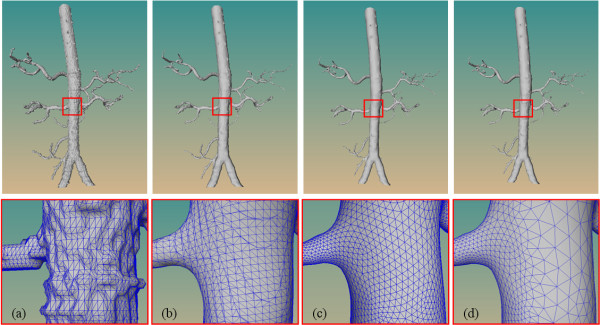
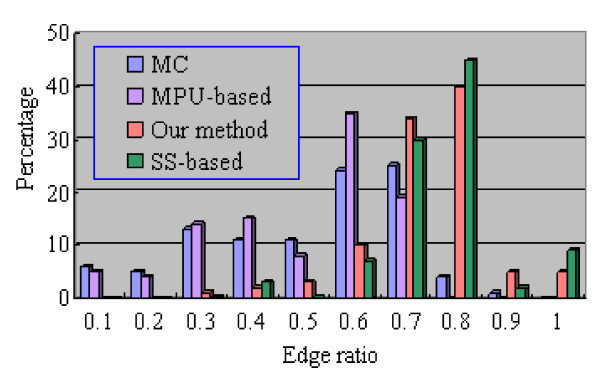
Results: Experiments carried out on several typical vascular structures demonstrate that the presented method yields both a smooth morphologically correct and a topologically preserved two-manifold surface, which is scale-adaptive to the local curvature of the surface. Furthermore, the presented method produces fewer and better-shaped triangles with satisfactory surface quality and accuracy.

Conclusions: Compared to other state-of-the-art approaches, our method reaches good balance in terms of smoothness, accuracy, triangle quality and surface size. The vessel surfaces produced by our method are suitable for applications such as computational fluid dynamics simulations and real-time virtual interventional surgery.


Figures

Figure 1
Figure 1
Pipeline of the geometric modeling of vascular tree structures. Pipeline of the geometric modeling of vascular tree structures
Figure 2
Figure 2
Example of point extraction. Example of generating point (blue) based on constellations of object voxels (grey) and outer boundary voxel (blue)
Figure 3
Figure 3
Illustration of calculating the radius of curvature at a given point. The illustration of calculating the radius of curvature at a given point
Figure 4
Figure 4
The generation process of initial mesh. First generating a regular hexagon (the dashed lines in blue) in the plane tangent to p, and projecting the vertices of the hexagon onto implicit surfaces to estimate curvature. Then adjusting the edge length of the hexagon to ρ·r, and finally, projecting the vertices of hexagon onto surface again to generate an initial mesh, consisting of vertices p1,⋯,p6 and p.
Figure 5
Figure 5
A fragment illustrating the mesh-expanding procedure. The red lines are boundary edges of the mesh and stored in a queue. From the boundary edges, new triangles are progressively generated. Note that the blue lines combined with one boundary edge will construct a new triangle if it satisfies two specified conditions. If two boundary edges make an angle less than 70 degrees, the three vertices on these two edges are used to produce a new triangle, see the triangle consisting of the green dashed line and the other two boundary edges.
Figure 6
Figure 6
Polygonization of a trifurcate model. A long gap is produced upon the termination of mesh expanding stage (left), and is sewed in the subsequent gap-stitching stage (right).
Figure 7
Figure 7
A cerebral vessel surface model produced by our approach. A cerebral vessel surface model produced by our approach
Figure 8
Figure 8
Comparison of the geometric modeling results on a liver tree. Surface model generated by the MC algorithm (a), MPU-based algorithm (b) and our approach (c). Color-coded visualization of the root mean square curvature distribution for the generated surface using MC algorithm (d), MPU-based algorithm (e) and our approach (f).
Figure 9
Figure 9
Comparison of triangle quality for an aorta tree. Surface model generated by the MC (a), MPU-based method (b), SS-based method (c) and our method (d). The bottom row is a zoomed region corresponding to the rectangle region of the top row.
Figure 10
Figure 10
The distribution of edge ratio of the aorta tree. The distribution of edge ratio of the aorta tree.

References

    1. Oeltze SB, Preim B. 3D visualization of vasculature: an overview. Visualization in medicine and life sciences. 2007. pp. 19–39.
    1. Piccinelli M, Veneziani A, Steinman DA, Remuzzi A, Antiga L. A framework for geometric analysis of vascular structures: application to cerebral aneurysms. IEEE Trans Med Imag. 2009;28(8):1141–1155. doi: 10.1109/TMI.2009.2021652. - DOI - PubMed
    1. Joshi A, Qian X, Dione DP, Bulsara KR, Breuer CK, Sinusas AJ, Papademetris X. Effective visualization of complex vascular structures using a non-parametric vessel detection method. IEEE Trans Visual Comput Graph. 2008;14(6):1603–1610. doi: 10.1109/TVCG.2008.123. - DOI - PMC - PubMed
    1. Ding S, Ye Y, Tu J, Subic A. Region-based geometric modelling of human airways and arterial vessels. Comput Med Imag Graph. 2010;34(2):114–121. doi: 10.1016/j.compmedimag.2009.07.005. - DOI - PubMed
    1. Volkau I, Ng TT, Marchenko Y, Nowinski WL. On geometric modeling of the human intracranial venous system. IEEE Trans Med Imag. 2008;27(6):745–751. doi: 10.1109/TMI.2007.911004. - DOI - PubMed

Publication types

LinkOut - more resources