. 2011 Jan 28;286(4):2864-76.
doi: 10.1074/jbc.M110.143271. Epub 2010 Nov 17.

Prolylcarboxypeptidase regulates proliferation, autophagy, and resistance to 4-hydroxytamoxifen-induced cytotoxicity in estrogen receptor-positive breast cancer cells

Affiliations

Prolylcarboxypeptidase regulates proliferation, autophagy, and resistance to 4-hydroxytamoxifen-induced cytotoxicity in estrogen receptor-positive breast cancer cells

Lei Duan et al. J Biol Chem. .

Abstract

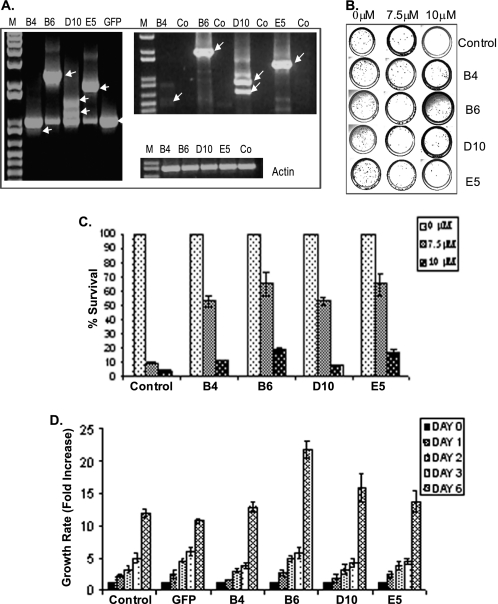
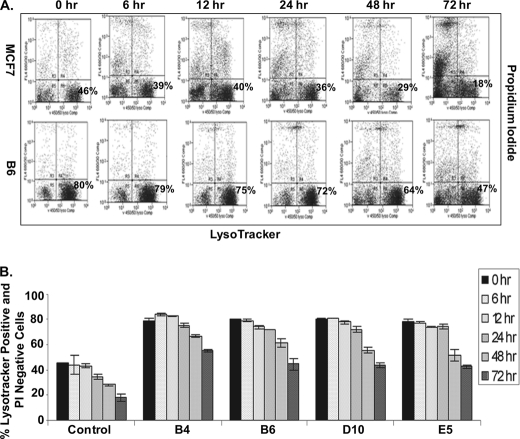
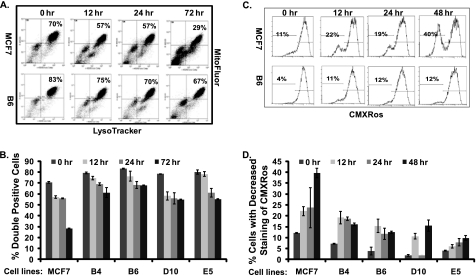
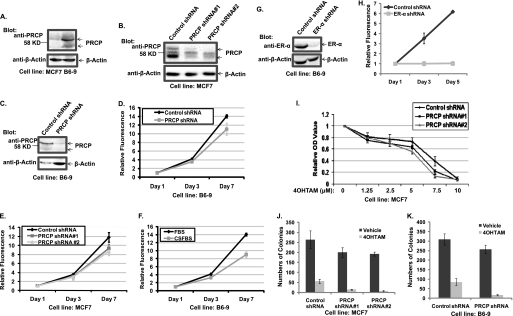
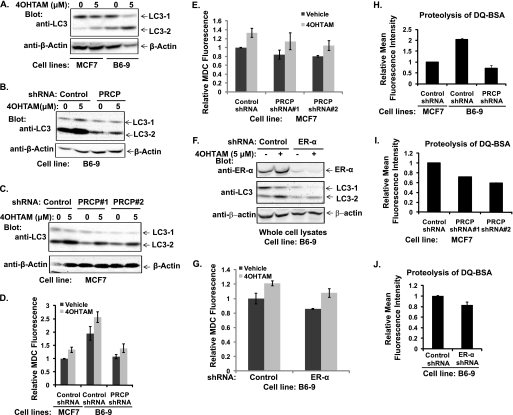
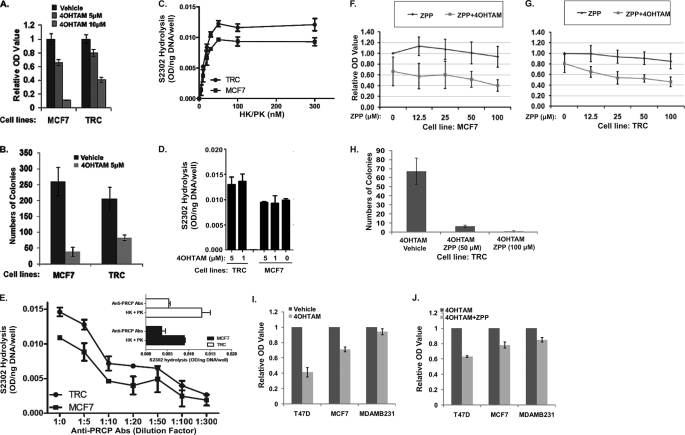
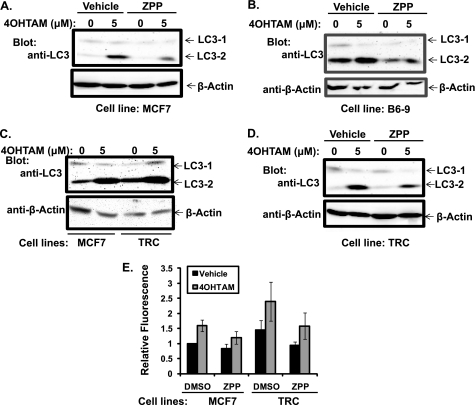
Endocrine therapy with tamoxifen (TAM) significantly improves outcomes for patients with estrogen receptor-positive breast cancer. However, intrinsic (de novo) or acquired resistance to TAM occurs in a significant proportion of treated patients. To identify genes involved in resistance to TAM, we introduced full-length cDNA expression library into estrogen receptor-positive MCF7 cells and exposed them to a cytotoxic dose of 4-hydroxytamoxifen (4OHTAM). Four different library inserts were isolated from surviving clones. Re-introduction of the genes individually into naive MCF7 cells made them resistant to 4OHTAM. Cells overexpressing these genes had an increase in acidic autophagic vacuoles induced by 4OHTAM, suggesting their role in autophagy. One of them, prolylcarboxypeptidase (PRCP), was investigated further. Overexpression of PRCP increased cell proliferation, boosted several established markers of autophagy, including expression of LC3-2, sequestration of monodansylcadaverine, and proteolysis of BSA in an ER-α dependent manner, and increased resistance to 4OHTAM. Conversely, knockdown of endogenous PRCP in MCF7 cells increased cell sensitivity to 4OHTAM and at the same time decreased cell proliferation and expression of LC3-2, sequestration of monodansylcadaverine, and proteolysis of BSA. Inhibition of enzymatic activity of PRCP enhanced 4OHTAM-induced cytotoxicity in MCF7 cells. Cells with acquired resistance to 4OHTAM exhibited increased PRCP activity, although inhibition of PRCP prevented development of 4OHTAM resistance in parental MCF7 cells and restored response to 4OHTAM in MCF7 cells with acquired resistance to 4OHTAM. Thus, we have for the first time identified PRCP as a resistance factor for 4OHTAM resistance in estrogen receptor-positive breast cancer cells.


Figures

FIGURE 1.
FIGURE 1.
Re-transduction of identified cDNA inserts made MCF7 cells resistant to 4OHTAM. A, integration of corresponding cDNA inserts confirmed by PCR using genomic DNA from re-infected populations (left panel). Expression of delivered cDNA inserts confirmed by RT-PCR using total RNA from the same populations (right panel). RT-PCR of actin was used as a control. Source of the genomic DNA or total RNA is indicated on top. Co-control reactions were assembled with cDNA from parental MCF7 cells. B, clonogenic assay was performed in triplicate in p60-mm dishes, treated with vehicle or 4OHTAM for 3 days, and then recovered in drug-free media for 2 weeks. Colonies were stained with methylene blue. C, colonies were quantified and normalized to vehicle-treated controls. The average relative numbers of colonies were presented with standard deviation shown (representative graph of three independent experiments). D, indicated cell lines were cultured in drug-free media and were harvested at the indicated time points and stained with Hoechst 33342 for cellular DNA. The fluorescence values were normalized to the cells harvested on day 1.
FIGURE 2.
FIGURE 2.
RIGs-expressing cells have increased AVO formation in response to 4OHTAM, which is correlated with increased plasma membrane integrity. A, MCF7, B4, B6, D10, and E5 cell lines were treated with 10 μm 4OHTAM for a time course, co-stained with propidium iodide and LysoTracker Blue DND-22, and analyzed by FACS. The Blue DND-positive and PI-negative cells were gated at the lower right corner (representative picture of three independent experiments in MCF7 cells and B6 cells). B, average percentage of Blue DND-positive and PI-negative cells in all of the cell lines in triplicate was presented as a graph with standard deviation indicated (representative graph of three independent experiments).
FIGURE 3.
FIGURE 3.
Increased AVO formation in RIGs-expressing cells is correlated with increased mitochondrial mass and a stabilized mitochondrial transmembrane potential. A, MCF7, B4, B6, D10, and E5 cell lines were treated with 10 μm 4OHTAM and co-stained with Mitofluor and LysoTracker Blue DND-22 for a time course, and their fluorescence was measured by FACS. The Blue DND and Mitofluor double-stained cells were gated at the lower right corner (representative picture of three independent experiments in MCF7 cells and B6 cells). B, average percentage of Blue DND- and Mitofluor-positive cells from triplicate were presented as a graph with standard deviation indicated (representative graph of three independent experiments). C, MCF7, B4, B6, D10, and E5 cell lines were treated with 10 μm 4OHTAM and stained with CMXRos for a time course, and their fluorescence was measured by FACS at the indicated time points. The cells with decreased staining of CMXRos were gated on the left (representative picture of three independent experiments in MCF7 cells and B6 cells). D, average percentage of cells with decreased staining of CMXRos (in triplicate) was presented as a graph with standard deviation indicated (representative graph of three independent experiments).
FIGURE 4.
FIGURE 4.
PRCP regulates cell proliferations, which are dependent on ER-α. Overexpression of PRCP decreases and knockdown of PRCP increases 4OHTAM-induced cytotoxicity. A, whole cell lysates of MCF7 and B6-9 were probed with the goat anti-PRCP antibody. Note that two bands around the 58-kDa marker are detected by the goat anti-PRCP antibody. B, whole cell lysates of MCF7-control shRNA, MCF7-PRCP shRNA1 and -2, were probed with the mouse anti-PRCP antibody (Abcam). Note that the mouse anti-PRCP antibody detects three bands, and only the signal of the upper and lower bands is decreased in PRCP shRNA-expressing cells. C, whole cell lysates of B6-9-control shRNA and B6-9-PRCP shRNA were probed with the goat anti-PRCP antibody. D and E, cells were grown in 96-well plates (2.5 × 10³ cells/well) in octuplicate for the time indicated, stained with PicoGreen, and the average fluorescence intensity evaluated. Values at days 3 and 7 were normalized to the basal (day 1) value and presented as graphs with standard deviation shown (representative graph of two independent experiments). F, B6-9-control shRNA cells were grown in medium containing regular FBS or charcoal-striped FBS (CSFBS) were also compared for their proliferation by PicoGreen staining (representative graph of two independent experiments). G, whole cell lysates of B6-9-control shRNA and B6-9-ER-α shRNA were probed with anti-ER-α antibodies. H, B6-9-control shRNA cells and B6-9 ERα shRNA cells were grown in medium containing regular FBS, and their proliferation was compared by PicoGreen staining (representative graph of two independent experiments). I, MCF7-control shRNA and MCF7-PRCP shRNA1 and -2 cells in 96-well plates were treated with different doses of 4OHTAM for 3 days. The cells were analyzed with the MTT assay, and the average OD values from octuplicate were normalized to the vehicle-treated cells and presented as a graph with standard deviation indicated (representative graph of three independent experiments). There are significant differences between control shRNA and PRCP shRNA1 cells treated with 5 μm (p = 0.006) and 7.5 μm 4OHTAM (p = 6 × 10⁻⁵) and PRCP2 cells treated with 5 μm (p = 0.002) and 7.5 μm 4OHTAM (p = 2 × 10⁻⁵). There are no significant differences between control shRNA and PRCP shRNA1 (p = 0.08, 0.06, and 0.12) and PRCP2 (p = 0.06, 0.11, and 0.23) treated with 1.25, 2. 5, and 10 μm of 4OHTAM. J, clonogenic assay was performed in control shRNA and PRCP shRNA1 and -2 expressing MCF7 cells treated with vehicle or 5 μm 4OHTAM in triplicate. The average colony numbers were presented as a graph with standard deviation indicated (representative graph of two independent experiments). There are no significant differences between vehicle-treated control shRNA cells and PRCP shRNA1 (p = 0.21) and PRCP2 cells (p = 0.09). There are significant differences between TAM-treated control shRNA cells and PRCP shRNA1 cells (p = 0.03) and PRCP shRNA2 (p = 0.03) cells. K, clonogenic assay was performed in B6-9 control shRNA and B6-9-PRCP shRNA cells treated with vehicle or 5 μm 4OHTAM in triplicate. The average colony numbers were presented as a graph with standard deviation indicated (representative graph of two independent experiments). There is no significant difference between vehicle-treated B6-9-control shRNA cells and B6-9-PRCP shRNA cells (p = 0.2). There is significant difference between 4OHTAM-treated B6-9-control shRNA cells and B6-9-PRCP shRNA cells (p = 0.02).
FIGURE 5.
FIGURE 5.
Overexpression of PRCP up-regulates autophagy and knockdown of PRCP down-regulates autophagy. A, MCF7 and B6-9 cells were treated with vehicle or 5 μm 4OHTAM for 2 days. Whole cell lysates were immunoblotted for LC3 and β-actin (representative picture of three independent experiments). B, B6-9-control shRNA and B6-9-PRCP shRNA cells were treated with vehicle or 5 μm 4OHTAM for 2 days, and whole cell lysates were immunoblotted for LC3 and β-actin (representative picture of two independent experiments). C, MCF7-control shRNA and MCF7-PRCP shRNA1 and -2 cells were treated with vehicle or 5 μm 4OHTAM for 2 days. Whole cell lysates were immunoblotted for LC3 and β-actin (representative pictures of two independent experiments). D, MCF7-control shRNA, B6-9-control shRNA, and B6-9-PRCP shRNA cells were treated with vehicle or 5 μm 4OHTAM for 2 days, and MDC sequestration was analyzed. The average MDC fluorescence (in triplicate) was normalized to the vehicle-treated B6-9-control shRNA cells and presented as a graph with standard deviation indicated (representative graph of three independent experiments). There are significant differences between B6-9-control shRNA and B6-9-PRCP shRNA cells treated with either vehicle (p = 0.03) or 5 μm 4OHTAM (p = 0.03). E, MCF7-control shRNA and MCF7-PRCP shRNA1 and -2 cells were treated with vehicle or 5 μm 4OHTAM for 2 days, and MDC sequestration assay was performed. The average MDC fluorescence in triplicate was normalized to the vehicle treated MCF7-control shRNA cells and presented as a graph with standard deviation indicated (representative graph of three independent experiments). There are significant differences between vehicle-treated MCF7-control shRNA and PRCP shRNA cells (p = 0.03 for shRNA1 and -2). F and G, B6-9-control shRNA and B6-9-ER-α shRNA cells were treated with vehicle or 5 μm 4OHTAM for 2 days. Whole cell lysates were immunoblotted for ER-α, LC3, and β-actin (F). MDC sequestration assay was performed, and the average MDC fluorescence in triplicate was normalized to the vehicle-treated B6-9-control shRNA cells and presented as a graph with standard deviation indicated (representative graph of two independent experiments). H–J, FACS analysis of proteolysis of DQ-Red-BSA in cells. H, MCF7-control shRNA, B6-9-control shRNA, and B6-9-PRCP shRNA cells were assessed, and the average mean fluorescence intensity in triplicate was normalized to the MCF7-control shRNA cells and presented as a graph with standard deviation indicated. There are significant differences between MCF7-control shRNA cells and B6-9-control shRNA cells (p = 0.007), and between B6-9-control shRNA cells and B6-9-PRCP shRNA cells (p = 0.002). I, MCF7-control shRNA and MCF7-PRCP shRNA1 and -2 cells were assessed, and the average mean fluorescence intensity in triplicate was normalized to MCF7-control shRNA cells and presented as a graph with standard deviation indicated. There are significant differences between MCF7-control shRNA cells and MCF7-PRCP-shRNA1 cells (p = 0.05) and MCF7-PRCP shRNA2 cells (p = 0.001). J, B6-9-control shRNA and B6-9-ER-α shRNA were assessed and the average mean fluorescence intensity in triplicate was normalized to B6-9-control shRNA cells and presented as a graph with standard deviation indicated (representative graphs of two independent experiments).
FIGURE 6.
FIGURE 6.
MCF7 cells that acquired resistance to 4OHTAM show increased PRCP activity. Inhibition of PRCP enhances TAM-induced cytotoxicity in 4OHTAM-sensitive and -resistant MCF7 cells and shows more effect in ER-positive T47D and MCF7 cells than ER-negative MDAMB231 cells. A, MCF7 and TRC cells were treated with vehicle or 4OHTAM (5 and 10 μm) for 3 days. The cell viability was assessed by the MTT assay. The average OD values of octuplicate were normalized to the vehicle-treated cells and presented as a graph with standard deviation indicated (representative experiments of three independent experiments). B, MCF7 cells and TRC cells were treated with vehicle or 5 μm 4OHTAM for 14 days and recovered for 14 days. The numbers of cell colonies were presented as a graph with standard deviation indicated (representative graph of two independent experiments). C, activation of the high molecular weight kininogen-PK complex on human breast carcinoma cell lines. Confluent monolayers of MCF7 (■) or TRC (●) cell cultures were incubated with the various concentrations of the complex of high molecular weight kininogen -PK and the generation of kallikrein by PRCP measured after 1 h. The substrate HD-Pro-Phe-Arg-paranitroaniline (S2302, 0.8 mm) was used to determine kallikrein activity. The absorbance of hydrolyzed S2302 was normalized to cellular DNA (ng) measured by PicoGreen. Data represent the mean ± S.E. of three experiments in triplicate. The absence of standard error bars indicates that the variation was too little to be visualized. D, effect of 4-hydroxytamoxifen on PRCP-dependent PK activation in MCF7 and TRC cells. Cells were treated with 1 or 5 μm 4OHTAM and analyzed for kallikrein activity. The absorbance of hydrolyzed S2302 was normalized to cellular DNA (ng) measured by PicoGreen. Data represent the mean ± S.E. of three experiments in triplicate. E, effect of anti-human PRCP IgG on the activation of PK on the cell-bound high molecular weight kininogen. Confluent monolayers of MCF7 (■) or TRC (●) cells were treated with high molecular weight kininogen (20 nm) and incubated for 1 h at 37 °C. Cells were subsequently incubated with the increasing amount of anti-human PRCP IgG in the presence of PK (20 nm) and analyzed for kallikrein activity. S2302 (0.8 mm) was used to determine kallikrein activity. The inset shows the inhibition of the PRCP-PK activation by anti-human PRCP IgG (1:100 dilution) on MCF7 and TRC cells. The absorbance of hydrolyzed S2302 was normalized to cellular DNA (ng) measured by PicoGreen. Data represent the mean ± S.E. of three experiments in triplicate. F and G, MCF7 cells (F) and the TRC cells (G) (in triplicate) were treated with different doses of ZPP and/or 5 μm 4OHTAM for 3 days and analyzed by the MTT assay. The average OD values were normalized to the vehicle-treated cells and presented as graphs with standard deviation indicated (representative graph of three independent experiments). There is no significant difference between the vehicle-treated and ZPP-treated MCF7 cells (one-way ANOVA: F = 2.29, p = 0.06). There is significant difference between TAM/vehicle-treated and TAM/ZPP-treated MCF7 cells (one-way ANOVA: F = 2.75, p = 0.04). There is no significant difference between the vehicle-treated and ZPP-treated TRC cells (one-way ANOVA: F = 1.88, p = 0.14). There is significant difference between 4OHTAM/vehicle-treated and 4OHTAM/ZPP-treated TRC cells (one-way ANOVA: F = 13.9, p = 0). H, clonogenic assay of the TRC cells treated with vehicle or 5 μm 4OHTAM in combination with vehicle or 50 and 100 μm of ZPP. The average numbers of colonies in triplicate were normalized to vehicle-treated cells and presented as a graph with standard deviation indicated (representative graph of two independent experiments). There are significant differences between 4OHTAM/vehicle-treated TRC cells and 4OHTAM/ZPP-treated cells (p = 0.02 and 0.001). I and J, T47D, MCF7, and MDAMB231 cells were treated with vehicle or 5 μm 4OHTAM in the presence of vehicle or 100 μm ZPP for 3 days. The cell viability was assessed by the MTT assay. The average OD values of octuplicate were normalized to the vehicle-treated (I) or 4OHTAM-treated (J) cells and presented as a graph with standard deviation indicated (representative experiments of three independent experiments).
FIGURE 7.
FIGURE 7.
Autophagy is inhibited by ZPP in MCF7s, B6-9, and the TRC cells, which show higher autophagy activity. A and B, MCF7 (A) and B6-9 (B) cells were treated with 4OHTAM/vehicle and 4OHTAM/ZPP for 2 days. Whole cell lysates were immunoblotted for LC3 and β-actin (representative picture of three independent experiments). C, MCF7 cell and the TRC cells were treated with 4OHTAM for 2 days. Whole cell lysates were immunoblotted for LC3 and β-actin (representative picture of three independent experiments). D, TRC cells were treated with 4OHTAM/vehicle and 4OHTAM/ZPP for 2 days. Whole cell lysates were immunoblotted for LC3 and β-actin (representative picture of three independent experiments). E, MCF7 and TRC cells were treated with 4OHTAM/vehicle and 4OHTAM/ZPP for 2 days. MDC sequestration assay was performed. The average MDC fluorescence in triplicate was normalized to the vehicle treated MCF7 cells and presented as a graph with standard deviation as error bars (representative graph of three independent experiments).

Similar articles

Cited by

References

    1. Jordan V. C. (2004) Cancer Cell 5, 207–213 - PubMed
    1. Arafah B. M., Griffin P., Gordon N. H., Pearson O. H. (1986) Cancer Res. 46, 3268–3272 - PubMed
    1. Reddel R. R., Murphy L. C., Hall R. E., Sutherland R. L. (1985) Cancer Res. 45, 1525–1531 - PubMed
    1. Clarke R., Liu M. C., Bouker K. B., Gu Z., Lee R. Y., Zhu Y., Skaar T. C., Gomez B., O'Brien K., Wang Y., Hilakivi-Clarke L. A. (2003) Oncogene 22, 7316–7339 - PubMed
    1. Poole R., Paridaens R. (2007) Curr. Opin. Oncol. 19, 564–572 - PubMed

Publication types

MeSH terms