Comparative Study
. 2011 Jan 15;11(2):263-76.
doi: 10.4161/cbt.11.2.13959. Epub 2011 Jan 15.

Anticancer activity of Celastrol in combination with ErbB2-targeted therapeutics for treatment of ErbB2-overexpressing breast cancers

Affiliations
Comparative Study

Anticancer activity of Celastrol in combination with ErbB2-targeted therapeutics for treatment of ErbB2-overexpressing breast cancers

Srikumar M Raja et al. Cancer Biol Ther. .

Abstract

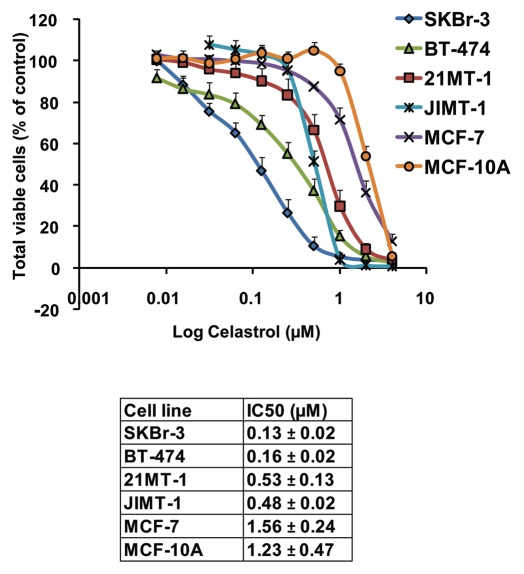
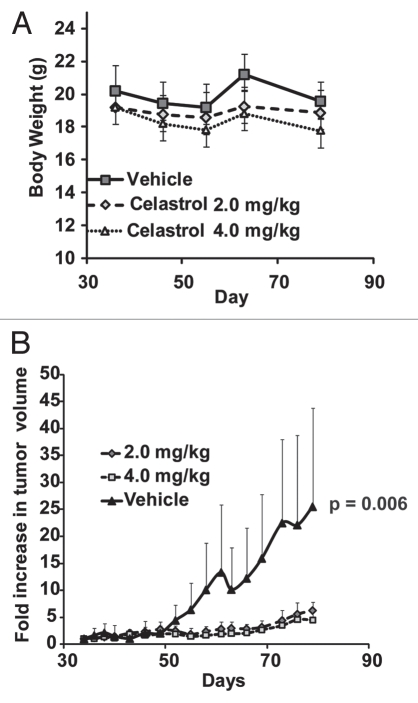
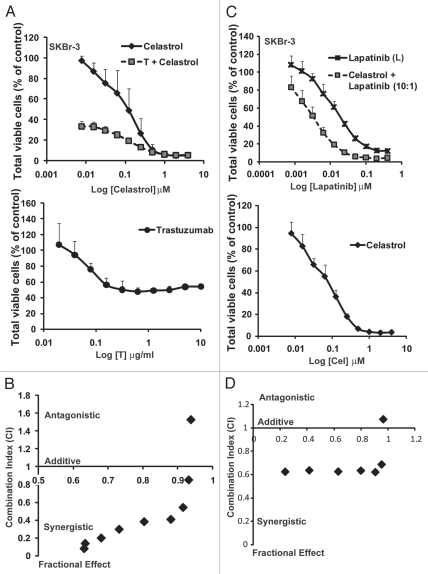
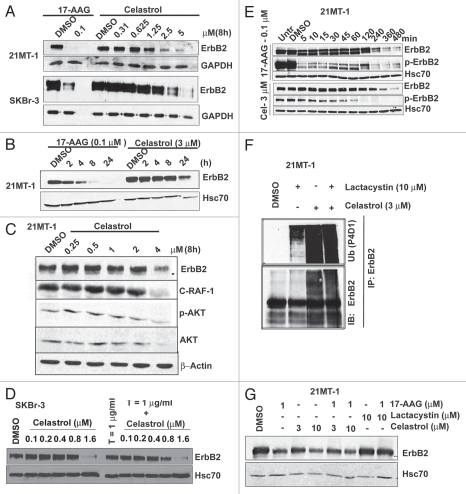
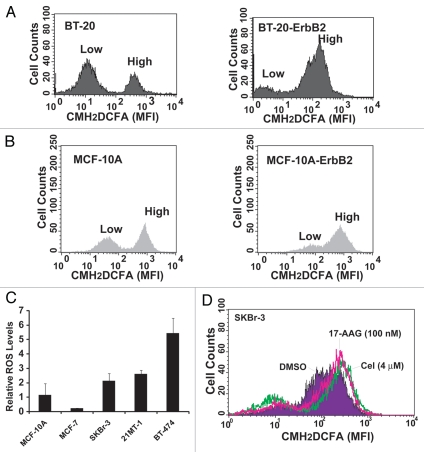
The receptor tyrosine kinase ErbB2 is overexpressed in up to a third of breast cancers, allowing targeted therapy with ErbB2-directed humanized antibodies such as Trastuzumab. Concurrent targeting of ErbB2 stability with HSP90 inhibitors is synergistic with Trastuzumab, suggesting that pharmacological agents that can inhibit HSP90 as well as signaling pathways activated by ErbB2 could be useful against ErbB2-overexpressing breast cancers. The triterpene natural product Celastrol inhibits HSP90 and several pathways relevant to ErbB2-dependent oncogenesis including the NFκB pathway and the proteasome, and has shown promising activity in other cancer models. Here, we demonstrate that Celastrol exhibits in vitro antitumor activity against a panel of human breast cancer cell lines with selectivity towards those overexpressing ErbB2. Celastrol strongly synergized with ErbB2-targeted therapeutics Trastuzumab and Lapatinib, producing higher cytotoxicity with substantially lower doses of Celastrol. Celastrol significantly retarded the rate of growth of ErbB2-overexpressing human breast cancer cells in a mouse xenograft model with only minor systemic toxicity. Mechanistically, Celastrol not only induced the expected ubiquitinylation and degradation of ErbB2 and other HSP90 client proteins, but it also increased the levels of reactive oxygen species (ROS). Our studies show that the Michael Acceptor functionality in Celastrol is important for its ability to destabilize ErbB2 and exert its bioactivity against ErbB2-overexpressing breast cancer cells. These studies suggest the potential use of Michael acceptor-containing molecules as novel therapeutic modalities against ErbB2-driven breast cancer by targeting multiple biological attributes of the driver oncogene.


Figures

Figure 1
Figure 1
Sensitivity of various breast cancer cell lines towards Celastrol. The sensitivity of a panel of breast cancer cell lines overexpressing ErbB2 (SKBr-3, BT-474, 21MT-1 and JIMT-1) to Celastrol were evaluated using MTT assay a described in the methods section. For comparison, ErbB2-low expressing cell lines MCF-7 and MCF-10A were also included. The viable cells at the end of treatment were assessed using the MTT dye assay and data represented as % of vehicle control. Shown here are the dose-response curves (mean of three independent experiments run in duplicates) for killing of breast cancer cells with Celastrol. The calculated IC50 values are tabulated below.
Figure 2
Figure 2
Celastrol retards growth of ErB2-overexpressing breast cancers in xenograft models: NOD-SCID mice with BT-474 tumor xenografts (n = 10 per treatment group) were treated with vehicle control or the indicated doses of Celastrol, as detailed in the experimental section. The change in body weight is shown in (A), whereas (B) compares the increase in tumor volume (relative to the initial tumor volume before drug treatment ±SE) with and without drug treatment. Statistical differences were estimated using Student's t-test (two-tailed; two-sample equal variance).
Figure 3
Figure 3
Celastrol in combination with ErbB2-targeted drugs, Trastuzumab and Lapatinib, synergistically induces cytotoxicity ErbB2-overexpressing breast cancer cells: SKBr-3 cells were treated with Celastrol as a single drug or in combination with Trastuzumab or Lapatinib as described in the methods section. The viable cells at the end of treatment were assessed using the MTT dye assay and data represented as % of vehicle control. Shown here is the comparison of cytotoxicity of single drug treatments or combination with Trastuzumab (A) or Lapatinib (C), showing efficacy of combinatorial treatment over single drugs. (A) The IC50 for Celastrol alone was 0.13 ± 0.02 µM; whereas it was 0.0027 ± 0.001 µM when combined with Trastuzumab at 1 µg/ml. The % cell viability for SKBr-3 treated with Trastuzumab alone at this concentration was 51.4 ± 7.7. (C) The IC50 for Lapatinib was 25.5 ± 2.1 nM as a single drug versus 3.5 ± 1.6 nM when combined with Celastrol. Also shown are Chou-Talalay analyses for Celastrol plus Trastuzumab (B) or Celastrol plus Lapatinib (D) combination. Combination index (CI) <1 indicates synergy; CI ∼ 1 indicates additive effects; CI >1 indicates antagonism.
Figure 4
Figure 4
Celastrol induces the ubiquitinylation and degradation of ErbB2 and other HSP90 client proteins: (A) ErbB2-overexpressing breast cancer cell lines 21MT-1 and SKBr-3 were treated with 17-AAG or Celastrol at the indicated concentrations for 8 h. Shown here is the decrease in ErbB2-levels after treatment. GAPDH was used as a loading control. (B) 21MT-1 cells were treated with the 17-AAG (0.1 µM) or Celastrol (3 µM) for indicated the indicated time periods. Shown here is the comparison of the kinetics of Celastrol-induced ErbB2 degradation in 21MT-1 cells with that induced by 17-AAG, at the indicated concentrations. (C) 21MT-1 cells were treated with the indicated concentrations of Celastrol for 8 h. The effect of Celastrol on other HSP90 client proteins is shown here. (D) SKBr-3 cells were treated with the indicated concentrations of Celastrol (as a single drug) or in combination with Trastuzumab at 1 µg/ml for 48 h. Equal amount of protein from cell lysates were analyzed for changes in ErbB2 levels. Hsc70 was used as a loading control. (E) 21MT-1 cells were treated with 17-AAG or Celastrol at the indicated concentrations for the time periods shown. Cell lysates were analyzed for total ErbB2 and p-ErbB2 levels. Hsc70 is shown as a loading control. (F) 21MT-1 cells were treated (as indicated) with Lactacystin (Lct) or Celastrol (Cel) or Lct plus Cel, for a total of 4 h. Cell lysates in RIPA buffer were used for anti-ErbB2 immuno-precipitation and sequentially immunoblotted for Ub and ErbB2. (G) 21MT-1 cells were pre-treated for 1 h with Lactacystin or Celastrol, at the indicated concentrations followed by treatment with 17-AAG for an additional 3 h. Cell lysates were analyzed by immunoblotting for ErbB2 and Hsc70 (loading control).
Figure 5
Figure 5
Celastrol induces lysosomal degradation of ErbB2: 21MT-1 cells, grown on coverslips were treated with the indicated concentrations of Celastrol for the indicated time periods. The coverslips, after treatment, were immunostained for ErbB2 and LAMP-1. ErbB2 staining is in green and LAMP-1 in red; colocalized regions are seen as yellow.
Figure 6
Figure 6
The role of Michael acceptor moiety in Celastrol towards its activity to destabilize ErbB2: (A) 21MT-1 cells were treated with Celastrol (4 µM) or 17-AAG (1 µM) (from a 100x stock that was left untreated or pre-treated with DTT) for the indicated time points. Cell lysates were analyzed by immunoblotting for ErbB2 and β-actin (used as a loading control). (B) 21MT-1 cells were incubated (as indicated) for 3 h with Celastrol (with or without pre-treatment with DTT) in absence or presence of Lactacystin (cells pre-treated for 1 h). Anti-ErbB2 immunoprecipitates were sequentially immunoblotted for Ub and ErbB2.
Figure 7
Figure 7
Celastrol induces G1-arrest and apoptosis in ErbB2-overexpressing breast cancer cells: 21MT-1 cells were treated with the indicated concentrations of Celastrol for 24 h. Samples were prepared in triplicate wells. Following treatment, the samples were subjected to cell cycle analysis using FACS, as described in materials and methods. (A) Representative cell cycle profiles of DMSO-treated or Celastrol-treated 21MT-1 cells are shown and a table is presented detailing the % (±SD) of cells in various phases of cell cycle. (B) Comparison of % apoptotic cells in sub-G1 fraction analyzed from cell cycle analysis plots; (C) 21MT-1 cells were treated with 2 µM Celastrol or Dihydrocelastrol for 24 or 48 h and analyzed for apoptosis by Annexin-V staining using FACS. Propidium Iodide (PI) was included to identify dead versus dying population of cells. Shown here is the % Annexin-V positive/PI negative population (apoptotic cells); (D) 21MT-1 cells were treated at the indicated concentrations of Celastrol and for the indicated time periods. Cell lysates were analyzed for intact and cleaved PARP by immunoblotting. Hsc70 is shown as a loading control.
Figure 8
Figure 8
The requirement of ‘Michael acceptor’ functionality in the bioactivity of Celastrol: (A) Effect of reduction of the α,β-unsaturated carbonyl group by sodium borohydride on Celastrol- or Dihydrocelastrol-induced cell death in SKBr-3 cells. Cells were incubated with DMSO or indicated concentrations of Celastrol or Dihydrocelastrol. Photographs were acquired using a bright field microscope with a x20 or x40 objective. (B) Comparison of Celastrol and Dihydrocelastrol for induction of ErbB2 degradation in 21MT-1 cells. Samples from the experiment shown in (A) were analyzed for ErbB2 degradation using immunoblotting. Hsc70 is shown as a loading control. (C and D) Comparison of the effects of Celastrol and Dihydrocelastrol on SKBr-3 (C) or BT-474 (D) cell lines as measured in an MTT assay. Cells were treated with the indicated concentrations of Celastrol of Dihydrocelastrol for 3 days. Cell growth was measured by MTT assay.
Figure 9
Figure 9
Correlation between ErbB2 expression and basal ROS levels: Parental BT-20 (A) or MCF-10A (B) cell lines and their ErbB2-overexpressing derivatives were analyzed for basal ROS levels by loading with 5 µM CM-H2DCFDA followed by flow cytometry. Typically two peaks are seen in the FACS profile, representing distinct population of cells with low and high ROS. Note an increase in the brighter peak upon ErbB2 overexpression. (C) Comparison of basal ROS levels among breast cancer cell lines. Cells were grown for 48 h, trypsinized and stained with CM-H2DCFDA. Each cell line was analyzed in triplicates. The relative ROS levels are expressed as a ratio of cells with high ROS to low ROS, as analyzed from the two peaks (seen in A and B). (D) Effect of Celastrol or 17-AAG on basal ROS levels in SKBr-3 cell line. Cells treated with Celastrol or 17-AAG at the indicated concentrations for 4 h, following by analysis of ROS levels using flow cytometry after CM-H2DCFDA loading.
Figure 10
Figure 10
The anti-oxidant N-acetyl Cysteine delays although it does not abrogate Celastrol-induced cell death. (A) Effect of N-acetyl Cysteine (NAC) on Celastrol-induced cytotoxicity in SKBr-3 cell line. Cells were treated with the indicated concentrations of Celastrol with or without a 500-fold excess of NAC. Changes in cell morphology were recorded at the indicated time points under a bright field microscope using a x20 objective. (B) Quantification of the cytotoxic effect of Celastrol and protective effect of NAC analyzed by counting rounded cells. Celastrol induced cell death was evaluated by counting the number of rounded versus flat/attached cells for each treatment condition. The % of cells with rounded morphology (in relation to total cells counted) is shown. (C) Quantification of the cytotoxic effect of Celastrol and protective effect of NAC analyzed using Annexin-V staining. Cells were treated with Celastrol or Celastrol plus NAC for the indicated time points and analyzed for Annexin V staining using flow cytometry.

Similar articles

Cited by

References

    1. Browne BC, O'Brien N, Duffy MJ, Crown J, O'Donovan N. HER-2 signaling and inhibition in breast cancer. Curr Cancer Drug Targets. 2009;9:419–438. - PubMed
    1. Dean-Colomb W, Esteva FJ. Her2-positive breast cancer: Herceptin and beyond. Eur J Cancer. 2008;44:2806–2812. - PubMed
    1. Sorlie T, Perou CM, Tibshirani R, Aas T, Geisler S, Johnsen H, et al. Gene expression patterns of breast carcinomas distinguish tumor subclasses with clinical implications. Proc Natl Acad Sci USA. 2001;98:10869–10874. - PMC - PubMed
    1. Sorlie T, Tibshirani R, Parker J, Hastie T, Marron JS, Nobel A, et al. Repeated observation of breast tumor subtypes in independent gene expression data sets. Proc Natl Acad Sci USA. 2003;100:8418–8423. - PMC - PubMed
    1. Murphy CG, Modi S. HER2 breast cancer therapies: A review. Biologics. 2009;3:289–301. - PMC - PubMed

Publication types

MeSH terms