

Review
doi: 10.1097/JES.0b013e318201eed6.
Effect of thermal stress on cardiac function
Affiliations
- PMID: 21088607
- PMCID: PMC3076691
- DOI: 10.1097/JES.0b013e318201eed6
Item in Clipboard
Review
Effect of thermal stress on cardiac function
Exerc Sport Sci Rev.
2011 Jan.
Abstract
Whole-body heating decreases pulmonary capillary wedge pressure and cerebral vascular conductance and causes an inotropic shift in the Frank-Starling curve. Whole-body cooling increases pulmonary capillary wedge pressure and cerebral vascular conductance without changing systolic function. These and other data indicate that factors affecting cardiac function may mechanistically contribute to syncope during heat stress and improvements in orthostatic tolerance during cold stress.
Figures
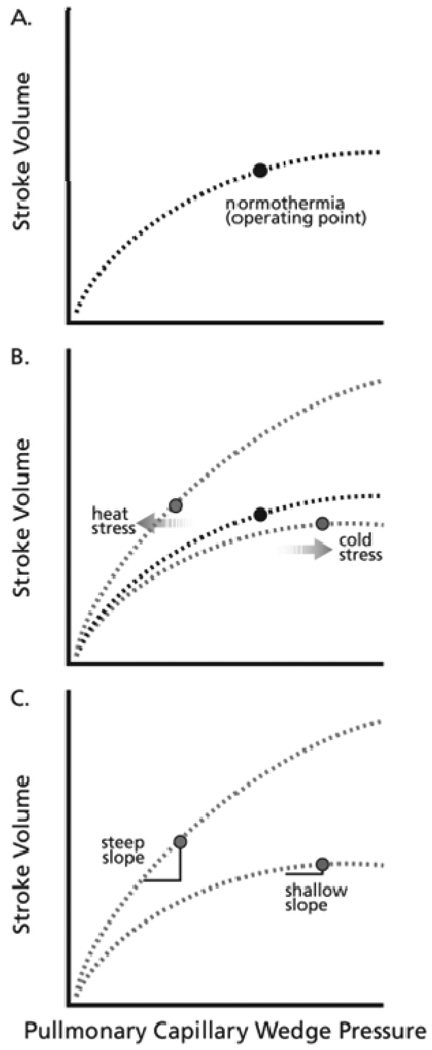
Schematic of the effect of thermal stress on the Frank-Starling relations. Panel A represents a normothermia Frank-Starling relation with the labeled point being the operating point in the supine position; Panel B represents associated changes in the curves related to heat stress and cold stress as well as the location of the supine operating points on those curves; Panel C highlights slope changes in the curves where a similar decrease in pulmonary capillary wedge pressure would cause a relatively large change in stroke volume during heat stress and a relatively small change during cold stress.
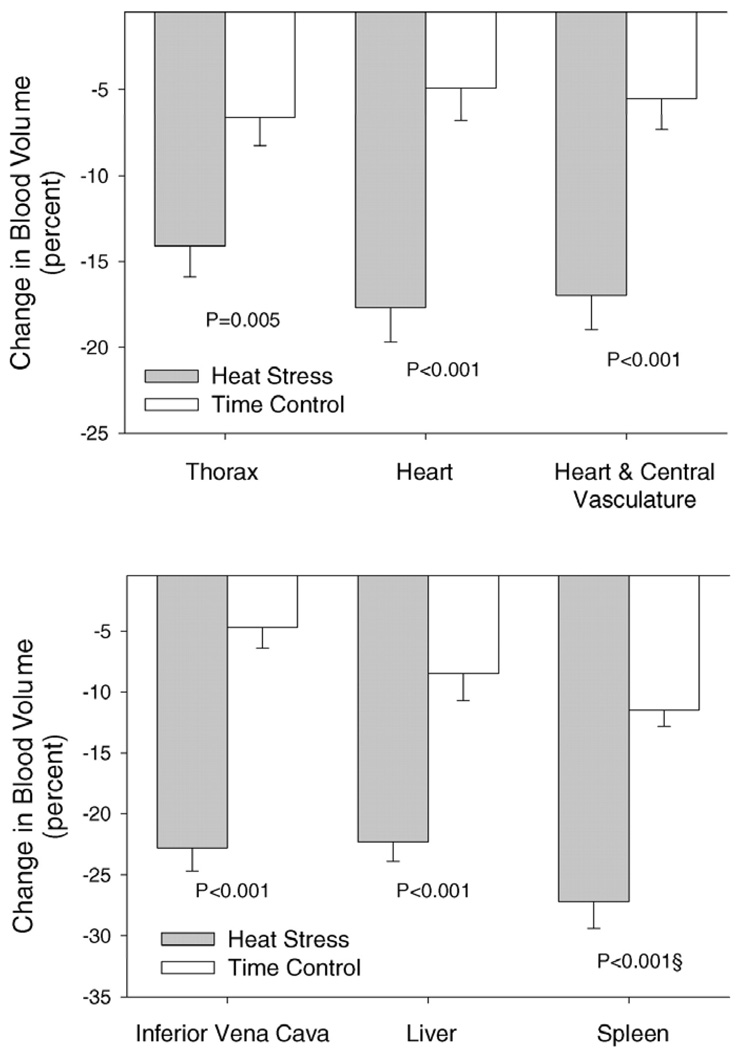
Percentage change in blood volume from the indicated regions between whole-body heating and associated normothermic time control subjects. (Reprinted from Crandall CG, Wilson TE, Marving J, et al. Effects of passive heating on central blood volume and ventricular dimensions in humans. J Physiol. 2008;586:293-301. Copyright © 2008 Wiley-Blackwell. Used with permission.)
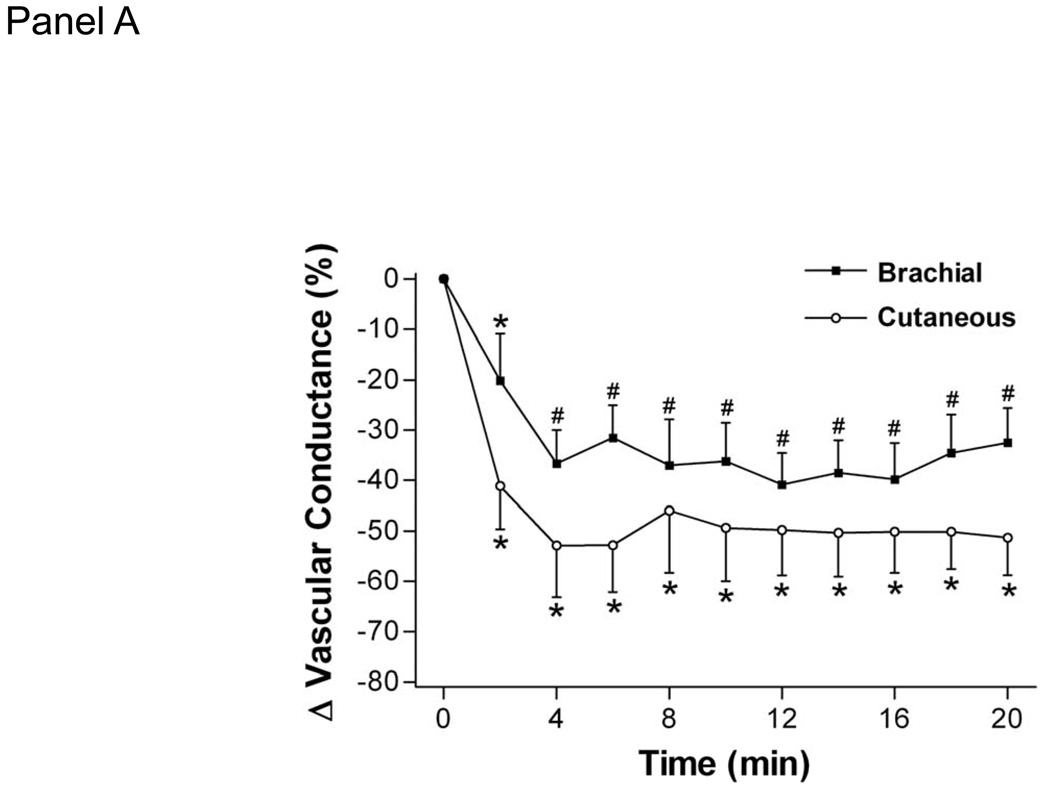
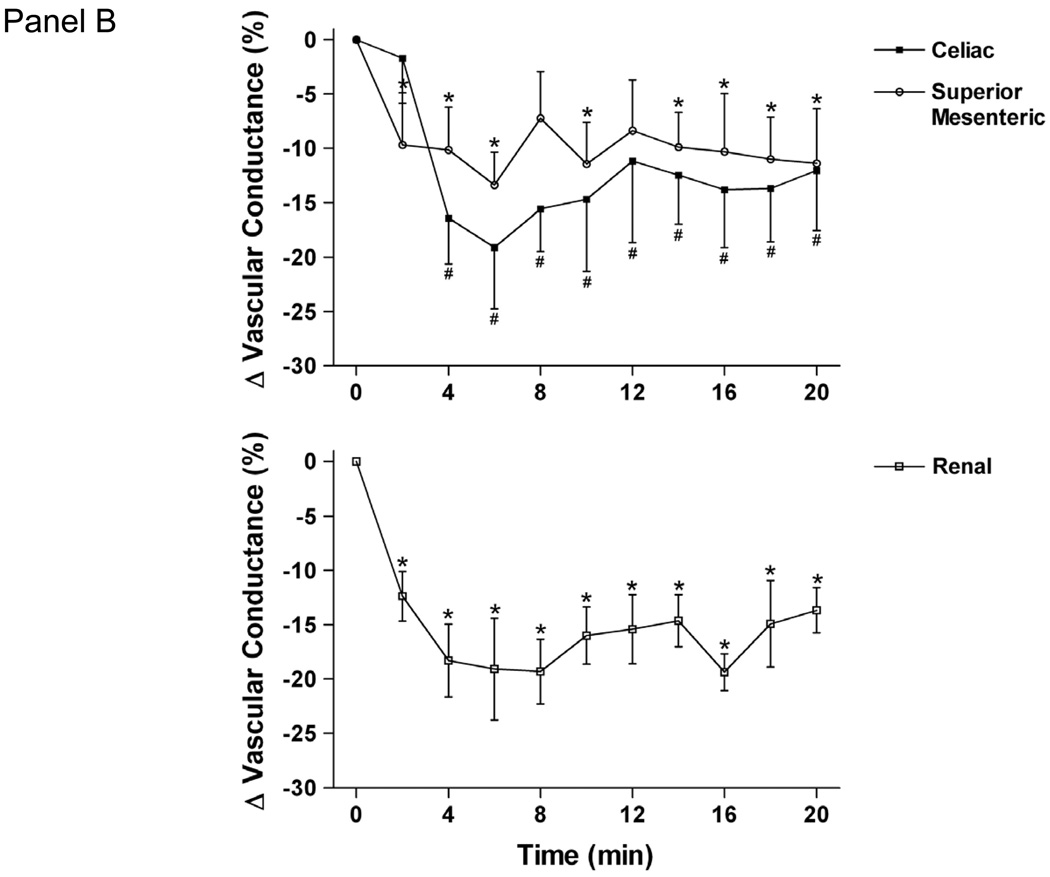
Effect of 20-min whole body cooling on the percent change (Δ) from baseline of brachial vascular conductance, cutaneous vascular conductance of the dorsal hand, celiac superior mesenteric, and renal vascular conductance indexes. Time 0 denotes normothermic baseline; baseline brachial vascular conductance =32 ± 15 cm·s−1mmHg−1, cutaneous vascular conductance =0.93 ± 0.68 flux units/mmHg, baseline celiac vascular conductance =85 ± 22 cm·s−1 mmHg−1, superior mesenteric vascular conductance = 55 ± 16 cm·s−1·mmHg−1, and renal vascular conductance = 74 ± 26 cm·s−1·mmHg−1. *Significant difference from time 0; P < 0.05. #Significant difference from both time 0 and minute 2, P < 0.05. (Reprinted from Wilson TE, Sauder CL, Kearney ML, et al. Skin-surface cooling elicits peripheral and visceral vasoconstriction in humans. J Appl Physiol. 2007;103:1257–1262. Copyright © 2007 The American Physiological Society. Used with permission.)
Effect of 20-min whole body cooling on the percent change (Δ) from baseline of brachial vascular conductance, cutaneous vascular conductance of the dorsal hand, celiac superior mesenteric, and renal vascular conductance indexes. Time 0 denotes normothermic baseline; baseline brachial vascular conductance =32 ± 15 cm·s−1mmHg−1, cutaneous vascular conductance =0.93 ± 0.68 flux units/mmHg, baseline celiac vascular conductance =85 ± 22 cm·s−1 mmHg−1, superior mesenteric vascular conductance = 55 ± 16 cm·s−1·mmHg−1, and renal vascular conductance = 74 ± 26 cm·s−1·mmHg−1. *Significant difference from time 0; P < 0.05. #Significant difference from both time 0 and minute 2, P < 0.05. (Reprinted from Wilson TE, Sauder CL, Kearney ML, et al. Skin-surface cooling elicits peripheral and visceral vasoconstriction in humans. J Appl Physiol. 2007;103:1257–1262. Copyright © 2007 The American Physiological Society. Used with permission.)
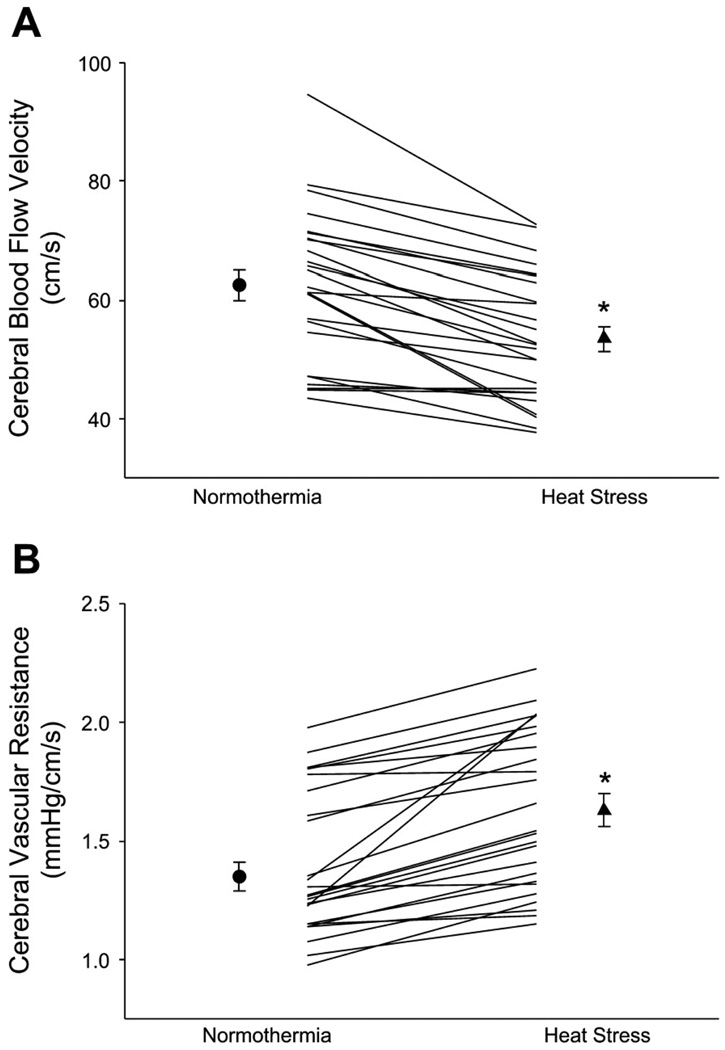
Effects of whole body heating on cerebral blood velocity from the middle cerebral artery (A) and calculated cerebral vascular resistance (B). The symbols with error bars denote mean responses, while lines denote individual responses. *P < 0.001. (Reprinted from Wilson TE, Gao Z, Hess KL, Monahan KD. Effect of aging on cardiac function during cold stress in humans. Am J Physiol Regul Integr Comp Physiol. 2010;298:R1627–1633. Copyright © 2010 The American Physiological Society. Used with permission.)
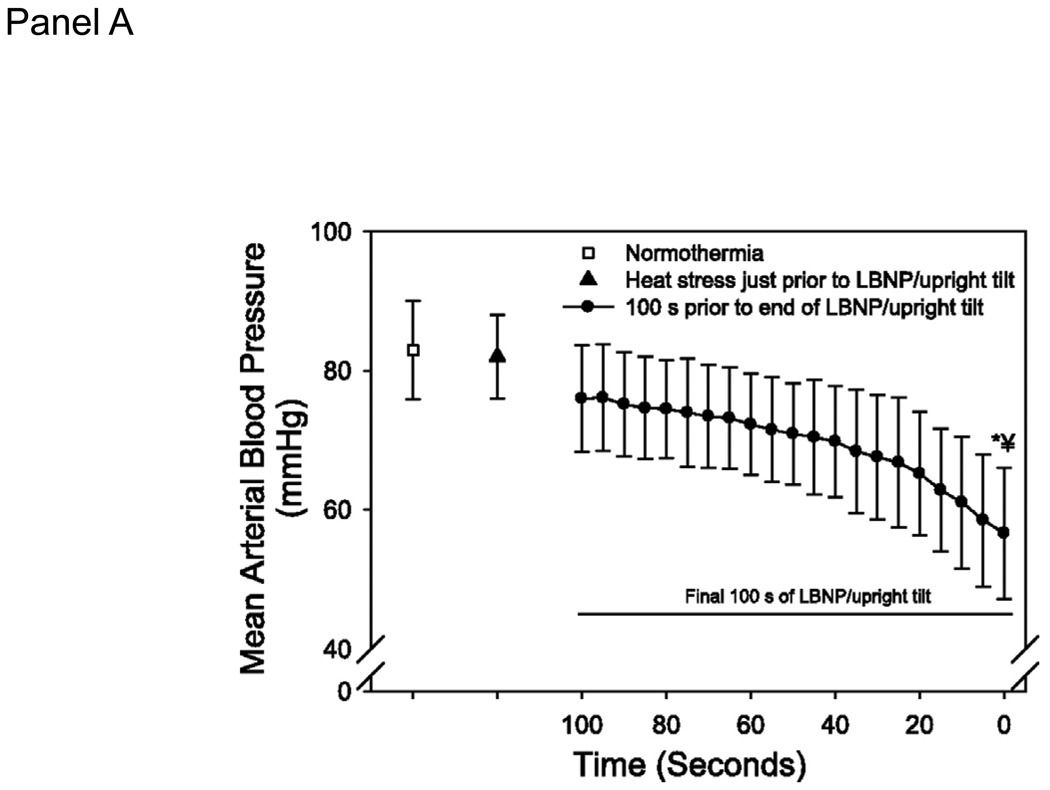
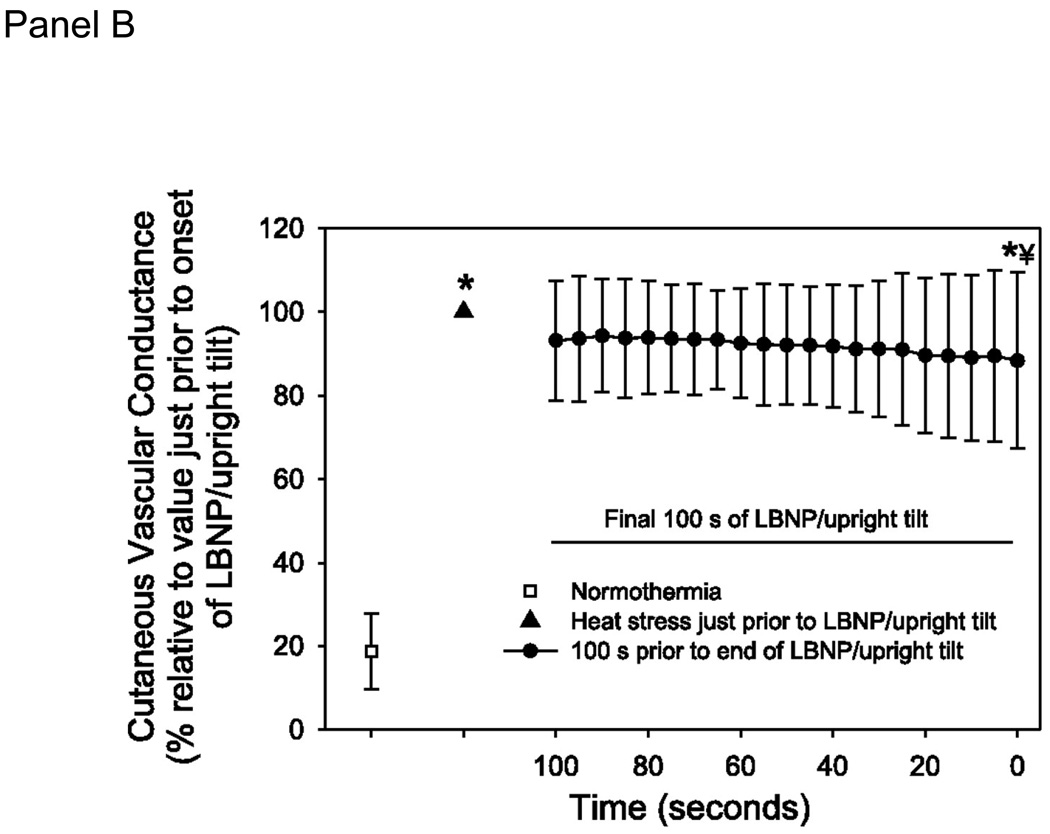
A. Cutaneous vascular conductance (CVC) at normothermia, heat stress, and the final 100 seconds prior to the end of the orthostatic challenge due to syncopal symptoms. Data are normalized relative to CVC just prior to the onset of the orthostatic challenge. Absolute CVC values are: normothermia: 29±20; heat stress: 160±58; end of orthostatic stress; 138±61 CVC units. B. Mean arterial blood pressure at normothermia, heat stress, and the final 100 seconds prior to the end of the orthostatic challenge due to syncopal symptoms. LBNP: lower body negative pressure. * significantly different from normothermia; � significantly different from heat stress. (Reprinted from Crandall CG, Shibasaki M, Wilson TE. Insufficient Cutaneous Vasoconstriction Leading up to and during Syncopal Symptoms in the Heat Stressed Human. Am J Physiol Heart Circ Physiol., 2010; 299:H1168–H1173. Copyright © 2010 The American Physiological Society. Used with permission.)
A. Cutaneous vascular conductance (CVC) at normothermia, heat stress, and the final 100 seconds prior to the end of the orthostatic challenge due to syncopal symptoms. Data are normalized relative to CVC just prior to the onset of the orthostatic challenge. Absolute CVC values are: normothermia: 29±20; heat stress: 160±58; end of orthostatic stress; 138±61 CVC units. B. Mean arterial blood pressure at normothermia, heat stress, and the final 100 seconds prior to the end of the orthostatic challenge due to syncopal symptoms. LBNP: lower body negative pressure. * significantly different from normothermia; � significantly different from heat stress. (Reprinted from Crandall CG, Shibasaki M, Wilson TE. Insufficient Cutaneous Vasoconstriction Leading up to and during Syncopal Symptoms in the Heat Stressed Human. Am J Physiol Heart Circ Physiol., 2010; 299:H1168–H1173. Copyright © 2010 The American Physiological Society. Used with permission.)
References
-
- Allan JR, Crossley RJ. Effect of controlled elevation of body temperature on human tolerance to +G z acceleration. J Appl Physiol. 1972;33:418–420. - PubMed
-
- Cai Y, Jenstrup M, Ide K, Perko M, Secher NH. Influence of temperature on the distribution of blood in humans as assessed by electrical impedance. Eur J Appl Physiol. 2000;81:443–448. - PubMed
Publication types
MeSH terms
Grants and funding
LinkOut - more resources
Full Text Sources
Other Literature Sources
Medical
