. 2010 Oct 21:4:165.
doi: 10.3389/fnins.2010.00165. eCollection 2010.

Molecular and anatomical signatures of sleep deprivation in the mouse brain

Affiliations

Molecular and anatomical signatures of sleep deprivation in the mouse brain

Carol L Thompson et al. Front Neurosci. .

Abstract

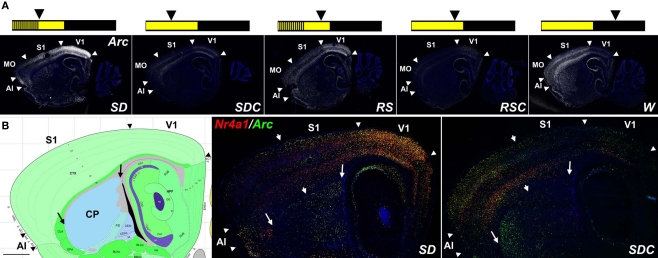
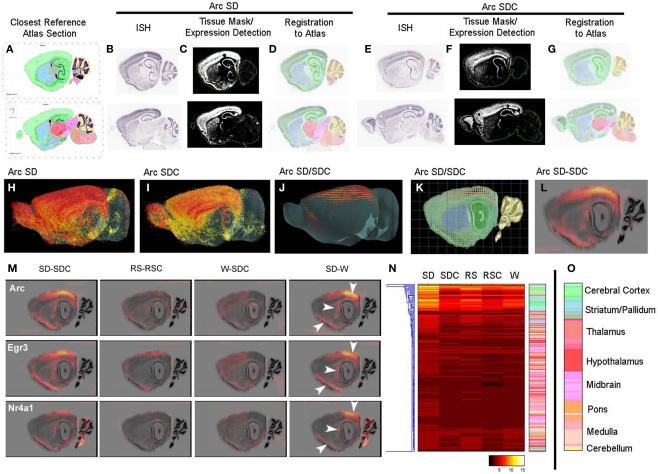
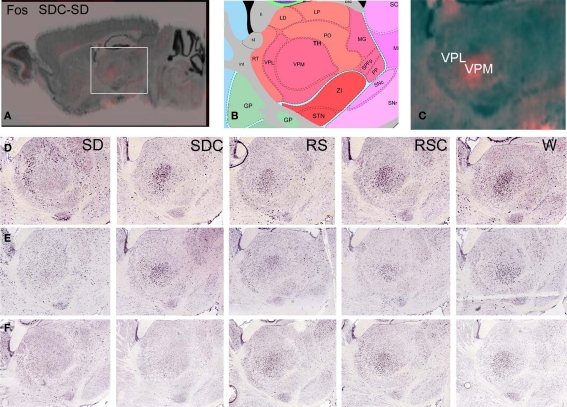
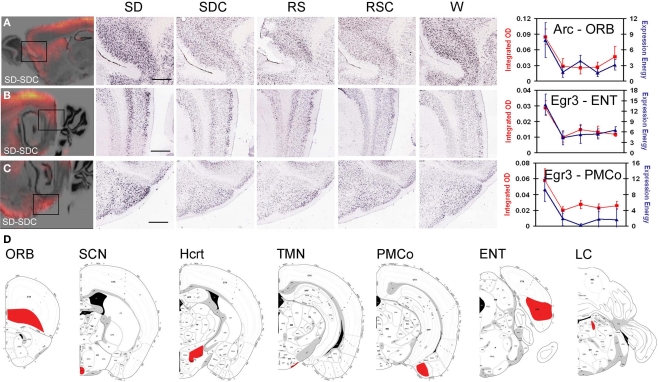
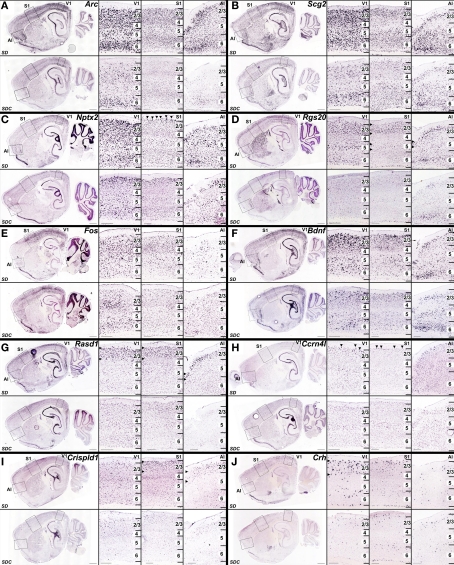
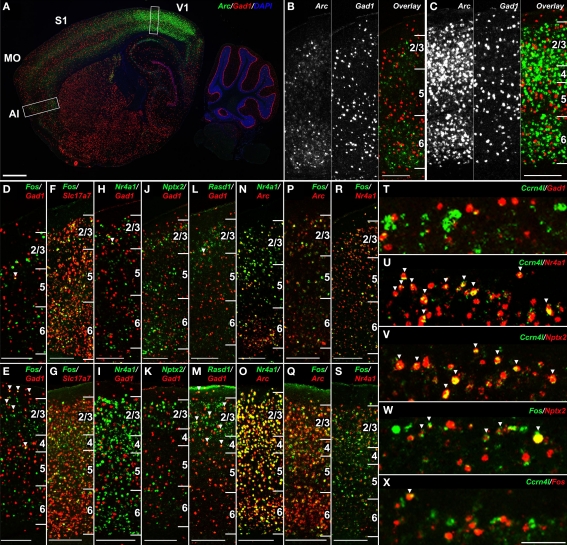
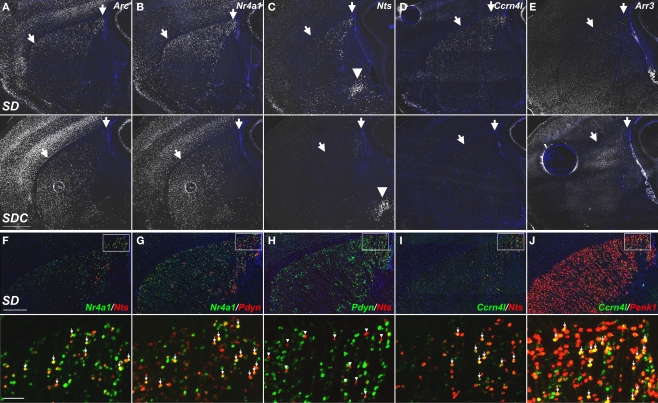
Sleep deprivation (SD) leads to a suite of cognitive and behavioral impairments, and yet the molecular consequences of SD in the brain are poorly understood. Using a systematic immediate-early gene (IEG) mapping to detect neuronal activation, the consequences of SD were mapped primarily to forebrain regions. SD was found to both induce and suppress IEG expression (and thus neuronal activity) in subregions of neocortex, striatum, and other brain regions. Laser microdissection and cDNA microarrays were used to identify the molecular consequences of SD in seven brain regions. In situ hybridization (ISH) for 222 genes selected from the microarray data and other sources confirmed that robust molecular changes were largely restricted to the forebrain. Analysis of the ISH data for 222 genes (publicly accessible at http://sleep.alleninstitute.org) provided a molecular and anatomic signature of the effects of SD on the brain. The suprachiasmatic nucleus (SCN) and the neocortex exhibited differential regulation of the same genes, such that in the SCN genes exhibited time-of-day effects while in the neocortex, genes exhibited only SD and waking (W) effects. In the neocortex, SD activated gene expression in areal-, layer-, and cell type-specific manner. In the forebrain, SD preferentially activated excitatory neurons, as demonstrated by double-labeling, except for striatum which consists primarily of inhibitory neurons. These data provide a characterization of the anatomical and cell type-specific signatures of SD on neuronal activity and gene expression that may account for the associated cognitive and behavioral effects.

Keywords: gene expression; in situ hybridization; microarray; sleep deprivation.


Figures

Figure 1
Figure 1
IEG mapping of neuronal activation in response to behavioral state. (A) Fluorescent Arc ISH (white) shows robust induction in SD, RS, and W relative to sleeping controls SDC and RSC, most notably in forebrain structures including discrete neocortical regions and the striatum. Summary schematics of the treatment conditions are shown across the top, in which the lights on portion of the LD12:12 light cycle is in yellow and the lights off portion in black; vertical lines represent sleep deprivation, and arrowheads indicate the time of sacrifice for each of the five experimental groups. (B) Double fluorescent ISH for Nr4a1 (red) and Arc (green) for SD and SDC, with extensive cellular colocalization of these two mRNAs (yellow cells). Arrowheads in (A) and (B) delineate major cortical areas, large arrows in (B) delineate the boundaries of the caudate putamen (CP)and arrowheads in (B) divide zones of higher rostral (left in SD) or caudal (right in SDC) IEG expression in the CP and neocortex. Left panel in (B) is an annotated reference atlas panel (Dong, 2008), plane-matched to the ISH images (right panels). All sections were counterstained with DAPI (blue). AI, agranular insular cortex; MO, motor cortex somatomotor cortex; S1, primary somatosensory cortex; V1, primary visual cortex. Scale bars: 1 mm.
Figure 2
Figure 2
Automated quantification and mapping of ISH data. (A–L) Quantification and registration of ISH data to an anatomical coordinate framework allowing statistical analysis of differential image-based gene expression across conditions, illustrated for Arc expression in SD (B–D) and SDC (E–G). Primary ISH data (B,E) is algorithmically segmented to create a quantified expression mask (C,F), and registered in 3D to a common anatomical coordinate framework based on an annotated reference atlas (A,D,G). ISH data are quantified in voxels of (200 μm)3, which can be visualized in 3D (H,I) and used to compute differential expression between conditions at this resolution (J,K). This 3D “difference grid” can be projected in 2D (superimposed on a Nissl section in (L)) and used to analyze differential expression at the level of brain region or voxel. (M) Difference grids of Arc, Egr3, and Nr4a1 show similar activation patterns by SD for these IEGs in specific anatomical structures including the neocortex, caudate putamen and piriform cortex visible at this resolution (arrows). SD leads to dramatic quantitative changes relative to SDC (left panel) and waking (right panel), while less robust differences are seen between W and SDC and between RS and RSC (middle panels). (N) Hierarchical clustering of Arc quantification across 209 brain regions over five behavioral conditions. Individual rows represent specific anatomical regions, color-coded by their position in the hierarchical structural ontology of the Allen Reference Atlas (right panel). The heatmap is colored by relative expression, based upon the metric expression energy(see Materials and Methods), with white/yellow representing high expression and black representing low expression, as denoted in the color key at the bottom. (O) Color key for anatomical regions as shown in (N).
Figure 3
Figure 3
Difference grid analysis identified decreased Fos expression in the ventral posteromedial nucleus of the thalamus during SD. Difference grid representation of upregulated Fos expression in SDC versus SD, showing higher expression (orange) in SDC than SD in VPM at low magnification (A) and high magnification (C). Corresponding reference atlas panel is shown in (B). (D–F) Colorimetric Fos ISH demonstrating differential Fos mRNA localization in SD, with lowest levels in VPM in SD relative to all other conditions, with higher SD expression in surrounding thalamic areas, for three replicate experiments.
Figure 4
Figure 4
Regions assayed by laser microdissection and microarray. IEG mapping identified three forebrain regions affected by SD, including orbitofrontal cortex [ORB, (A)], entorhinal cortex [ENT, (B)] and posteromedial cortical amygdala [PMCo, (C)]. Left panels show difference grids for SD-SDC for Arc (A) and Egr3 (B,C). Middle panels show colorimetric ISH data for all five behavioral conditions at high magnification corresponding to the boxed areas in the difference grids. Right panels show quantification of SD induction using automated informatics quantification (blue) and manual integrated optical density measurements (red). Scale bars: 500 μm. (D) Coronal schematics indicating brain regions collected for laser microdissection (red) shown on atlas images from rostral (left) to caudal (right).
Figure 5
Figure 5
Gene expression showed a diversity of responses to time-of-day and treatment condition. Differentially expressed genes were identified by one-way ANOVA with a p-value cutoff of 0.05. For each identified gene, the expression values of four replicates were averaged and z-transformed (plotted on y-axis) and arranged to form a trend vector, with the expression values of the treatment groups plotted in the following order: SD, SDC, RS, RSC, and W [x-axis of each trend; labels shown in the first plot in (A)]. Hierarchical clustering was used to cluster differentially expressed genes into 25 trends per each of 7 regions, resulting in a total of 175 trends. For each cluster, the average expression trend of the cluster [plotted as colored, bolded line in (A–I)] was extracted by averaging the individual gene trend vectors (plotted as gray lines in (A–I)]. In order to compare similar trends across brain regions, the 175 expression trends were hierarchically clustered (not shown), and 48 of 175 trends are shown (A–I). At the top of each individual trend plot, the structure name and cluster number are shown with the number of genes within each cluster in parentheses. Gene ontology (GO) terms which were enriched in a gene cluster (DAVID, p < 0.05) are shown (structures exhibiting those terms are listed in parentheses). Color-coding of GO terms shows terms that are shared across multiple trend types. The right-most column lists examples of genes which have been validated by ISH for each structure either in the original ISH screen (gray font), or with triplicate data (black font).
Figure 6
Figure 6
Signatures of sleep deprivation by anatomic region. (A) The histogram shows the number of genes exhibiting differential expression between SD and SDC (ANOVA p < 0.05) per anatomic region based upon automated quantification of triplicate ISH data from 53 genes using expression energy. Histogram bars are color-coded by the anatomic ontology based upon the Allen Reference Atlas for adult mouse brain, and the key to the colors is shown to the far right. Below the histogram, anatomic regions are annotated for involvement in different functional pathways based on the published literature. (B,C) Heatmaps showing the response of genes to five behavioral conditions for subsets of brain regions (y-axis) involved in either learning and memory (B) or emotional behaviors (C). Along the x-axis, genes which exhibited differential gene expression across five conditions for any of the given brain regions as determined by triplicate ISH (ANOVA, p < 0.05) are shown. Abbreviations: DG, dentate gyrus; SUB, subiculum; TT, tania tecta; CTX, cerebral cortex; CA, Ammon's Horn CA region; ENT, entorhinal cortex; RSP, retrosplenial cortex; ILA, infralimbic area; ACA, anterior cingulate area; CEA, central nucleus of amygdala; sAMY, striatum-like amygdalar nuclei; AAA, anterior amygdalar area; BST, bed nuclei of stria terminalis; MEA, medial amygdalar nucleus; PA, posterior amygdalar nucleus; BLA, basolateral amygdala; LA, lateral amygdala; BMA, basomedial amygdala; COA, cortical amygdala; PAA, piriform-amygdalar area.
Figure 7
Figure 7
Signatures of sleep deprivation by gene. (A) The histogram shows the number of the 209 brain regions examined that showed statistically different expression in SD versus SDC (ANOVA p < 0.05) for the same ISH data set used in Figure 6. Histogram bars are color-coded by GO terminology for cellular component (key to far right). Note that some genes belong to multiple cellular component categories, as indicated by striped bars. (B) Annotation of genes for selected molecular function, biological process, or KEGG pathway terms. (C) Automated quantification across all five conditions showed that Sgk1, the gene showing the broadest anatomical response to SD in (A), exhibited widespread upregulation by both SD and by time-of-day (RS, RSC). (D,F) ISH data for Sgk1 across five behavioral conditions on a whole sagittal brain section (D) and in the hippocampus at high magnification (F). Sgk1 is upregulated selectively in oligodendrocyte–rich white matter tracts including the external capsule (ec, arrowhead) and fimbria (fi, arrow), delineated in a plane-matched Nissl-stained section (E). (G) Sgk expression in SDC strongly resembles the expression patterns of two well-known oligodendrocyte markers, Mobp and Cnp1. DG, dentate gyrus; CA1, CA3, hippocampal subfields. Scale bars: (D): 1 mm; (E,F): 500 μm.
Figure 8
Figure 8
Differential effects of behavioral condition on the SCN and orbital cortex. (A) Microarray values shown as z scores for four genes, Snf1lk, Dbp, Rasd1, and Nr4a1, for both orbital cortex (blue) and SCN (red), demonstrating the different trends shown for the same gene across different brain regions. (B,C) Colorimetric ISH on sagittal sections through the SCN (B) and orbital cortex (C) across five behavioral conditions for the four genes shown in (A). (D) Induction of Gfap in the SCN by SD. Labels across the top indicate the circadian time (ZT6, 10, or 18) and whether there was an experimental manipulation (SD or RS). Scale bar in (B): 500 μm. Scale bar in (C): 200 μm.
Figure 9
Figure 9
Heterogeneous cellular patterns of cortical gene upregulation by SD. (A–J) Colorimetric ISH for genes that were upregulated in SD (upper panels) relative to SDC (lower panels), shown at low magnification on a sagittal section through the lateral hippocampus (left), and at high magnification (right panels) in visual cortex (V1), somatosensory cortex (S1) and agranular insular cortex (AI) corresponding to boxed regions in low magnification images. Specific laminar and regional patterns of gene upregulation by SD varied from gene to gene, from broad upregulation in all three regions in all layers [e.g., Arc (A), Scg2 (B)], to increasingly layer- and region-specific upregulation for Nptx2 (C), Rgs20 (D), Fos (E), Bdnf (F), Rasd1 (G), Ccrn4l (H), Crispld1 (I), and Crh (J). Horizontal arrowheads in (D,G,I,J) indicate layer-specific SD induction, and arrowheads in (C) and (H) delineate selective gene induction in neurons at the upper boundary of layer 2. Scale bars: low magnification images, 1 mm; high magnification images, 250 μm.
Figure 10
Figure 10
SD-induced transcripts in the neocortex label overlapping populations of excitatory neurons. (A–C) Double fluorescent ISH for Arc (green) and Gad1 (red) at low magnification (A) and high magnification in agranular insular cortex (B) and visual cortex (C) corresponding to boxed regions in (A), demonstrating lack of co-labeling in the neocortex. (D–S) Cellular colocalization of genes showing cortical gene upregulation following SD with canonical inhibitory (Gad1) and excitatory (Slc17a7) neuronal markers and with one another in agranular insular cortex (D,F,H,J,L,N,P,R) and primary visual cortex (E,G,I,K,M,O,Q,S). Fos is largely restricted to excitatory neurons (D–G), neither Nr4a1 nor Nptx2 colocalize with Gad1 (H–K), and Rasd1 partially overlaps with Gad1 (L,M). Arc, Nr4a1 and Fos label partially overlapping neuronal populations (N–S). (T–X) Gene-specific cellular specificity in layer 2 of somatosensory cortex following SD. Ccrn4l is expressed in a subset of Nr4a1 and Nptx2-positive excitatory neurons (T–V),Fos partially overlaps with Nptx2 (W), yet Ccrn4l and Fos label nearly non-overlapping populations (X). Numbers in (B–S) delineate cortical layers. Scale bars: (A), 1 mm; (B–S), 250 μm; (T–X), 100 μm.
Figure 11
Figure 11
Molecular phenotyping neuronal populations exhibiting SD-induced gene expression in the dorsolateral caudate putamen. (A–E) Fluorescent ISH images showing selective induction of Arc, Nr4a1, Nts, Ccrn4l, and Arr3 in the caudal dorsolateral caudate putamen of SD (upper panels) and SDC (lower panels) groups. Striatal expression of Nts, Ccrn4l, and Arr3 was specific to SD, with no expression in SDC (C–E). Arrows indicate the approximate region showing SD gene upregulation. SD induction of Nts was specific to the caudate putamen, while expression in the amygdala [arrowheads in (C)] was unaffected by SD. (F–J) Cellular colocalization of SD-induced mRNAs using double fluorescent ISH. Upper panels show co-labeling across the entire dorsal caudate putamen, and lower panels show a magnified view corresponding to the boxed areas. Nts extensively colocalizes with Nr4a1 (F) and Ccrn4l (I), but does not overlap with Pdyn (H). Arrows in (F,G,I,J) indicate cells expressing both respective gene products. Arrowheads in H indicate Nts-expressing neurons that do not co-label with Pdyn. All sections were counterstained with DAPI (blue). Scale bars: (A–E), 1 mm; (F–J) upper panels, 500 μm; lower panels, 50 μm.

References

    1. Antle M. C., Silver R. (2005). Orchestrating time: arrangements of the brain circadian clock. Trends Neurosci. 28, 145–15110.1016/j.tins.2005.01.003 - DOI - PubMed
    1. Borbely A. A., Tobler I., Hanagasioglu M. (1984). Effect of sleep deprivation on sleep and EEG power spectra in the rat. Behav. Brain Res. 14, 171–18210.1016/0166-4328(84)90186-4 - DOI - PubMed
    1. Chee M. W., Chuah L. Y. (2008). Functional neuroimaging insights into how sleep and sleep deprivation affect memory and cognition. Curr. Opin. Neurol. 21, 417–42310.1097/WCO.0b013e3283052cf7 - DOI - PubMed
    1. Cirelli C. (2006). Cellular consequences of sleep deprivation in the brain. Sleep Med. Rev. 10, 307–32110.1016/j.smrv.2006.04.001 - DOI - PubMed
    1. Cirelli C., Gutierrez C. M., Tononi G. (2004). Extensive and divergent effects of sleep and wakefulness on brain gene expression. Neuron 41, 35–4310.1016/S0896-6273(03)00814-6 - DOI - PubMed