. 2010 Dec;239(12):3481-91.
doi: 10.1002/dvdy.22483.

A cross-species analysis of Satb2 expression suggests deep conservation across vertebrate lineages

Affiliations

A cross-species analysis of Satb2 expression suggests deep conservation across vertebrate lineages

Kelly Sheehan-Rooney et al. Dev Dyn. 2010 Dec.

Abstract

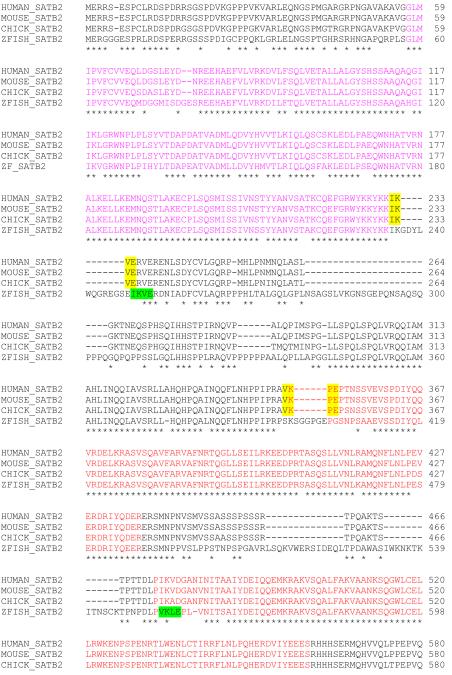
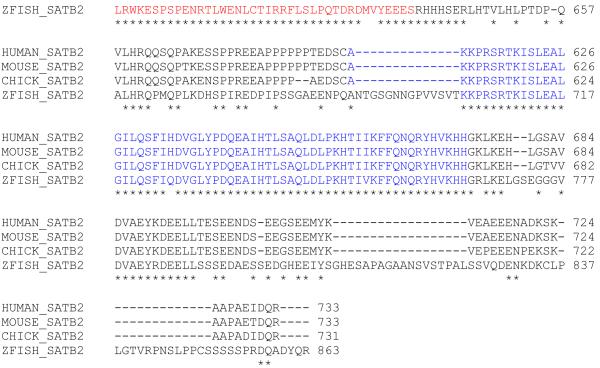
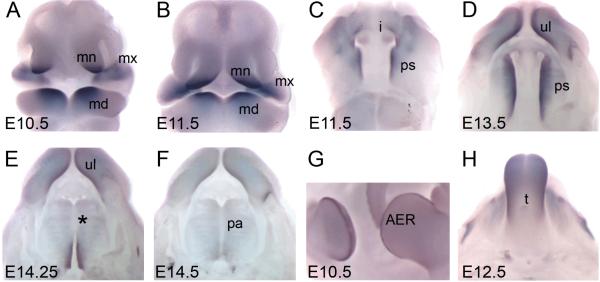
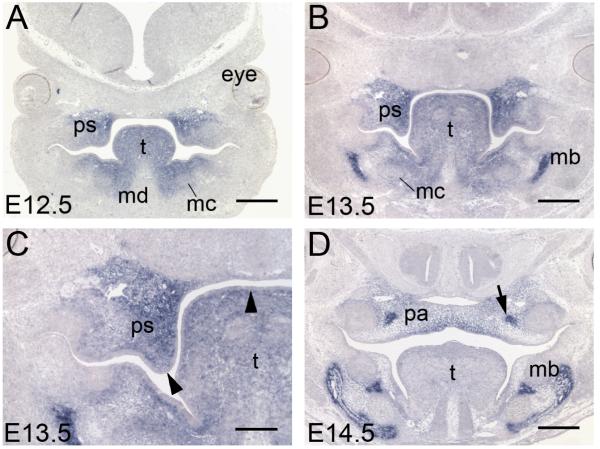
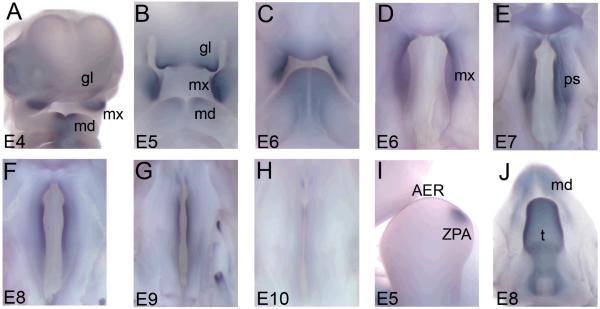
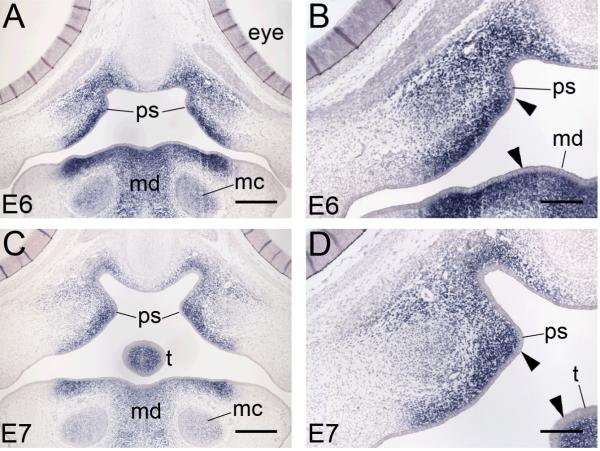
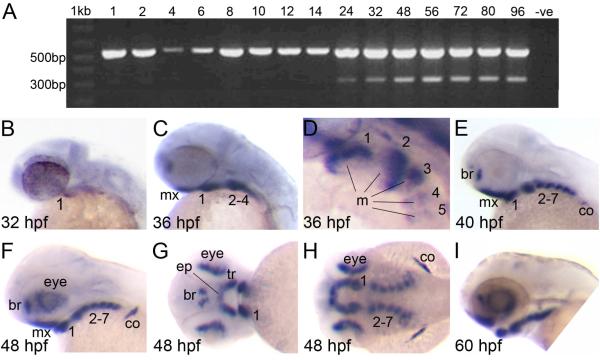
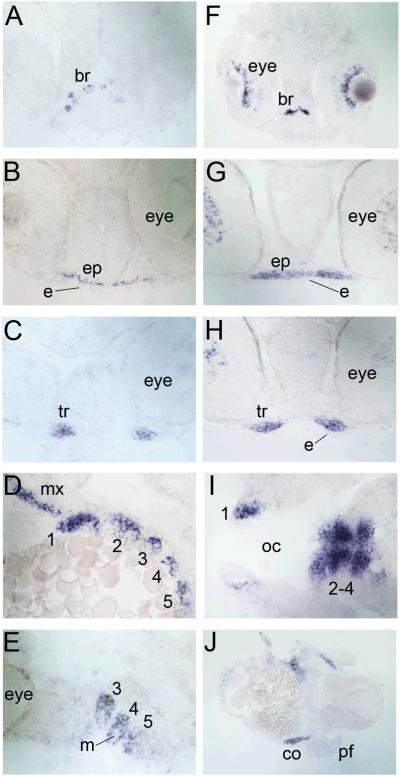
Mutation of SATB2 causes cleft palate in humans. To understand the role of SATB2 function in palatogenesis, SATB2 analyses in vertebrate model systems will be essential. To facilitate these analyses, we have performed a cross-species comparison of SATB2 structure and function across three vertebrate model systems: mouse, chick, and zebrafish. We find that the SATB2 transcript is highly conserved across human, mouse, chick, and zebrafish, especially within the Satb2 functional domains. Furthermore, our expression analyses demonstrate that SATB2 is likely to have similar functions in vertebrate model organisms and humans during development of the facial processes and secondary palate. Together, these data suggest an evolutionary conserved role for SATB2 during development of the face and palate across vertebrates. Moreover, expression of zebrafish satb2 in the anterior neurocranium supports the utility of the anterior neurocranium as a simplified model of amniote palatogenesis.


Figures

Figure 1
Figure 1. SATB2 orthologs are highly conserved
The full-length SATB2 protein sequences of human, mouse, chick and zebrafish were aligned using ClustalW. Identical amino acids are shown with a star (*). The SATB domain (pink), two CUT domains (red) and a homeobox domain (blue) are present in all four proteins. Two tetrapeptide SUMO motifs are present in the human, mouse and chick proteins (yellow). Two of the predicted SUMO motifs in zebrafish are highlighted in green with the predicted site of SUMO conjugation at K250 and K554.
Figure 2
Figure 2. Expression of murine Satb2 correlates with the structures affected when human SATB2 function is lost
Whole-mount in situ hybridization using the murine Satb2 antisense riboprobe reveals expression of Satb2 during embryogenesis. Images A and B are frontal views of the embryonic face. Removal of the lower jaw allows visualization of the developing secondary palate in images C-F. Image G is a lateral view of the limb buds and image H is a dorsal view of the tongue. (A) Satb2 expression was first detected at E10.5 in the mesenchyme of the medial nasal, maxillary and mandibular processes. (B) This expression pattern was maintained at E11.5 although expression in the mandibular processes appeared to be restricted more orally. (C) Satb2 expression was first evident at E11.5 on the oral side of the maxillary processes as well as in the incisor tooth germs. (D) At E13.5, strong Satb2 expression was detected along the entire anterior-posterior axis of the palatal shelves, as well as the upper lip. (E) At approximately E14.25, when the palatal shelves have adhered in the mid-region (asterisk), Satb2 was only detected in the most posterior regions of palatal shelves were they had not yet adhered. (F) By E14.5, when the palate has fused, no Satb2 expression was detected. (G, H) Expression of Satb2 is also evident throughout the AER of the limb buds and the tongue. mn, medial nasal process; mx, maxillary process; md, mandibular process; ul, upper lip; i, incisor tooth germ; ps, palatal shelves; pa, palate; AER, apical ectodermal ridge; t, tongue.
Figure 3
Figure 3. Murine Satb2 expression is restricted to the mesenchyme
(A-D) Coronal sections of Satb2 mRNA expression following section in situ hybridization. (A, B) During palatal growth at E12.5 and E13.5, Satb2 is strongly expressed in mesenchyme of developing palatal shelves, tongue, mandible, Meckel’s cartilage and mandibular bone. (C) A higher magnification image of B shows the epithelia of the palatal shelves and tongue do not express Satb2 (arrowheads). (D) At E14.5 when the palate is undergoing fusion in the midline, Satb2 expression is down-regulated in the tongue and the palatal mesenchyme but becomes concentrated in the zones of ossification of the future palatine bone (arrow). ps, palatal shelves; t, tongue; mc, Meckel’s cartilage; md, mandible; mb, mandibular bone; pa, palate. Scale bars: A, B, D = 500 μm, C = 250 μm.
Figure 4
Figure 4. The spatio-temporal expression profile of chick SATB2 is conserved to murine Satb2
Whole mount in situ hybridization using the antisense SATB2 riboprobe reveals expression of SATB2 during embryogenesis. Images A-C are frontal views of the embryonic face. Removal of the lower jaw allows visualization of the developing secondary palate in images D-H. Image I is a lateral view of the fore-limb and image J is a dorsal view of the tongue and mandible. (A) SATB2 expression was first detected at E4 in the globular, maxillary and mandibular processes. (B) At E5, abundant SATB2 expression was detected in the globular, maxillary processes and the developing mandible. (C, D) By E6, SATB2 expression was only present in the maxillary processes as well as the entire anterior-posterior axis of the developing palatal shelves. (D-H). SATB2 expression in the palatal shelves was most abundant at E7 with a gradual decline thereafter such that no expression is detected at E10. (I) At E5, SATB2 was expressed throughout the apical ectodermal ridge (AER) and the zone of polarising activity (ZPA) of the fore- and hind-limb buds. (J) At E8, SATB2 expression was abundant throughout the tongue. gl, globular process; mx, maxillary process; md, mandibular process; ps, palatal shelves; AER, apical ectodermal ridge; ZPA, zone of polarising activity; t, tongue.
Figure 5
Figure 5. Chick SATB2 expression is restricted to the mesenchyme
(A-D) Coronal sections of showing Satb2 mRNA expression following section in situ hybridization. (A-D) During palatal growth at E6 and E7 strong SATB2 expression is detected throughout the secondary palate mesenchyme. SATB2 is also expressed in the tongue and mandibular mesenchyme as well as the Meckel’s cartilage. (C, D) Higher magnification of images B and C shows the epithelia of the palatal shelves, mandible and tongue is SATB2 negative. ps, palatal shelves; t, tongue; mc, Meckel’s cartilage; md, mandible. Scale bars: A, C = 500 μm; B, D = 250 μm.
Figure 6
Figure 6. Expression of zebrafish satb2 is conserved compared to other vertebrates
(A) A duplex RT-PCR designed to simultaneously amplify β-actin (555 bp) and satb2 (306 bp) indicated that satb2 was expressed from 24 to 96 hpf. The negative control (−ve) in which the cDNA is replaced with sterile water did not produce an amplicon. (B-I) satb2 expression was analyzed using the satb2 antisense riboprobe. Images B, C, E, F and I are lateral images with anterior facing left. Image D is a higher magnification, dorso-lateral view of the pharyngeal arches in C. Image G is a frontal view of the embryonic face and image H is a dorsal view of the embryo shown in F and G. (B) satb2 expression was first detected at 32 hpf in the most anterior-ventral aspect of the first pharyngeal arch/mandible. (C, D) By 36 hpf, satb2 expression was detected in the ventral mesenchyme of pharyngeal arches 1-5 and maxillary condensations. (D) Expression in the pharyngeal arches clearly marked the mesenchyme surrounding a core of satb2-negative mesoderm. (E, F) This expression pattern persisted but became more intense such that by 40 hpf satb2 expression was observed in all the pharyngeal arches, forebrain, scapulocoracoid of the pectoral fin and, by 48 hpf, the eye. (G) Frontal views of 48 hpf larvae showed satb2 expression marking the trabeculae and ethmoid plate of the anterior neurocranium. (H) Expression in the arches appeared to mark areas that form the cartilage elements of the pharyngeal skeleton. (I) The expression pattern of satb2 continued until 60 hpf and thereafter declined. mx, maxillary condensations; 1-7, pharyngeal arches 1-7; m, mesoderm; br, forebrain; co, scapulocoracoid; tr, trabeculae; ep, ethmoid plate.
Figure 7
Figure 7. Zebrafish satb2 expression marks the pre-chondrogenic mesenchyme
Transverse (A-C, F-J) and parasagittal (D, E) sections are shown. Wild-type zebrafish embyos at 38 hpf (A-E) and 48 hpf (F-J) were sectioned following whole-mount in situ hybridization using the zebrafish antisense satb2 riboprobe. (A-C) Progressive sections along the anterior-posterior axis of the embryo at 38 hpf showed satb2 expression in the brain and the mesenchymal precursors of the ethmoid plate and trabeculae while the ectoderm was satb2-negative. (D,E) Parasagittal sections showed abundant satb2 expression in the mesenchyme of the maxillary condensations and pharyngeal arches 1-5 (1-5) that surrounded a core of satb2-negative mesoderm. (F-J) Progressive sections along the anterior-posterior axis of the embryo at 48 hpf showed satb2 expression in the brain and eyes. (G, H) satb2 expression was subsequently detected in the pre-chondrogenic mesenchyme of the ethmoid plate and trabeculae but not in the overlying ectoderm. (I, J) Further posteriorly, the pre-chondrogenic mesenchyme of all seven pharyngeal arches was satb2 positive as well as scapulocoracoid of the pectoral fin. br, brain; ep, ethmoid plate; tr, trabeculae; e, ectoderm; mx, maxillary condensations; 1-5, pharyngeal arches 1-5; m, mesoderm; co, scapulocoracoid; oc, oral cavity; pf, pectoral fin.

References

    1. Britanova O, Depew MJ, Schwark M, Thomas BL, Miletich I, Sharpe P, Tarabykin V. Satb2 haploinsufficiency phenocopies 2q32-q33 deletions, whereas loss suggests a fundamental role in the coordination of jaw development. American Journal of Human Genetics. 2006;79:668–678. - PMC - PubMed
    1. Clouthier DE, Schilling TF. Understanding endothelin-1 function during craniofacial development in the mouse and zebrafish. Birth Defects Res C Embryo Today. 2004;72:190–199. - PubMed
    1. Croen LA, Shaw GM, Wasserman CR, Tolarova MM. Racial and ethnic variations in the prevalence of orofacial clefts in California, 1983-1992. Am J Med Genet. 1998;79:42–47. - PubMed
    1. Dobreva G, Chahrour M, Dautzenberg M, Chirivella L, Kanzler B, Farinas I, Karsenty G, Grosschedl R. SATB2 is a multifunctional determinant of craniofacial patterning and osteoblast differentiation. Cell. 2006;125:971–986. - PubMed
    1. Dobreva G, Dambacher J, Grosschedl R. SUMO modification of a novel MAR-binding protein, SATB2, modulates immunoglobulin 11 3048 gene expression. Genes & Development. 2003;17:3048–3061. - PMC - PubMed

Publication types

MeSH terms

Substances