Comparative Study
. 2010 Dec;10(23):4270-80.
doi: 10.1002/pmic.200900768.

Protein expression profiles distinguish between experimental invasive pulmonary aspergillosis and Pseudomonas pneumonia

Affiliations
Comparative Study

Protein expression profiles distinguish between experimental invasive pulmonary aspergillosis and Pseudomonas pneumonia

Denise A Gonzales et al. Proteomics. 2010 Dec.

Abstract

We hypothesized that invasive pulmonary aspergillosis (IPA) may generate a distinctive proteomic signature in plasma and bronchoalveolar lavage (BAL). Proteins in plasma and BAL from two neutropenic rabbit models of IPA and Pseudomonas pneumonia were analyzed by SELDI-TOF MS. Hierarchical clustering analysis of plasma time course spectra demonstrated two clusters of peaks that were differentially regulated between IPA and Pseudomonas pneumonia (57 and 34 peaks, respectively, p<0.001). PCA of plasma proteins demonstrated a time-dependent separation of the two infections. A random forest analysis that ranked the top 30 spectral points distinguished between late Aspergillus and Pseudomonas pneumonias with 100% sensitivity and specificity. Based on spectral data analysis, three proteins were identified using SDS-PAGE and LC/MS and quantified using reverse phase arrays. Differences in the temporal sequence of plasma haptoglobin (p<0.001), apolipoprotein A1 (p<0.001) and transthyretin (p<0.038) were observed between IPA and Pseudomonas pneumonia, as was C-reactive protein (p<0.001). In summary, proteomic analysis of plasma and BAL proteins of experimental Aspergillus and Pseudomonas pneumonias demonstrates unique protein profiles with principal components and spectral regions that are shared in early infection and diverge at later stages of infection. Haptoglobin, apolipoprotein A1, transthyretin, and C-reactive protein are differentially expressed in these infections suggesting important contributions to host defense against IPA.


Conflict of interest statement

Conflicts of Interest

The authors have no financial or commercial conflicts of interest to declare regarding the content of this manuscript.

Figures

Figure 1
Figure 1. Hierarchical Clustering of Plasma Protein Peaks
SELDI-TOF spectra with automatic peak detection for peaks >10 times signal-to-noise ratio. Each column represents a single animal. Red denotes up-regulated or higher intensity peaks and green denotes down-regulated or lower intensity peaks. Only peaks with p < 0.001 are shown in each row. Rows are ordered by unsupervised hierarchical clustering. A: Response to Aspergillus fumigatus. The 21 peaks in the upper aspect are of high intensity at baseline and decrease by day 5. The 14 peaks in the lower aspect of the panel are of low intensity at baseline but peak by day 3. B: Response to Pseudomonas aeruginosa. The 10 peaks in the upper aspect are of high intensity at baseline and decrease by day 6. The 15 peaks in the lower aspect of the panel are of low intensity at baseline but peak between days 3 and 6.
Figure 2
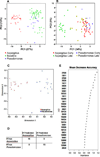
Figure 2. PCA and Random Forest Analysis of Plasma
The PCA of plasma separates infection type and early from late infection. Each symbol represents the PCA of the entire spectrum for an animal with a distinct infection. A: Aspergillus fumigatus infection (red, mean across days 4–7) separates along PC1 (26.7%, p<0.001) from Pseudomonas aeruginosa (blue, mean across day 4–7) and baseline (green, day 0) spectra. There is no significant separation along PC1 or PC2 of Pseudomonas aeruginosa from baseline. B: Late Aspergillus fumigatus infection (green, day 7–9) separates from early (red, day 0–2) Aspergillus fumigatus infection along PC1. Pseudomonas aeruginosa early (blue, day 0–2) and late (grey, day 7–14) infection responses do not separate from each other and appear similar to the early Aspergillus fumigatus response in PC1–PC2 space. Random forest analysis of late Aspergillus and Pseudomonas infections. C. Late Aspergillus (red, mean response of each animal days 7–9) and late Pseudomonas (blue, mean response of each animal days 7–14) groups are completely separated by random forest analysis along dimension 1. D. Sensitivity and specificity for predicting infectious type in this model are 100%. E. The protein peaks (m/z) are ranked in order of importance for separating Aspergillus from Pseudomonas late infections.
Figure 3
Figure 3. Heat Map and Principal Component Analysis of BAL Fluid
Entire transformed spectra for each animal ordered in columns by infection type. A: Entire transformed spectra in BAL fluid. Normal and neutropenic rabbit BAL fluid samples are compared to Pseudomonas and Aspergillus-infected BAL fluid. An additional group was discovered to have only light Pseudomonas growth in microbiologic evaluation and this correlated with a distinct proteomic profile. Qualitative differences in protein expression exist at 10, 11.7 and 17 kDa in the Pseudomonas and Aspergillus groups. B: The PC1 was uniformly −20 for the uninfected groups, intermediate at 0 for Pseudomonas pneumonia and +15 for Aspergillus rabbits. C: Protein profiles were averaged across all animals with each infection type. The averaged spectral responses were compared at every spectral point. Spectral regions with significant differences (p < 0.001 Student’s t-test) are denoted in blue.
Figure 4
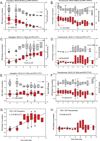
Figure 4. RPA validation of SELDI-TOF
The time course of the SELDI-TOF relative intensity compared to relative units of RPA are shown for the putative 28 kDa molecule, APOA1, 11.7 kDa molecule, HPT, and 13.7 kDa molecule TTHY as well as RPA measurement of C-reactive protein in Aspergillus infection (A, C, E, G) compared to Pseudomonas infection (B, D, F, H). Comparison of the time course of APOA1 (A and B), HPT (C and D), TTHY (E and F) and C-reactive protein expression (G and H) between the two infections were significantly different (APOA1, HPT and C-reactive protein all p < 0.001, TTHY, p < 0.038).

References

    1. Petricoin E, Wulfkuhle J, Espina V, Liotta LA. Clinical proteomics: revolutionizing disease detection and patient tailoring therapy. J Proteome Res. 2004;3:209–217. - PubMed
    1. Liotta LA, Ferrari M, Petricoin E. Clinical proteomics: written in blood. Nature. 2003;425:905. - PubMed
    1. Whelan LC, Power KA, McDowell DT, Kennedy J, Gallagher WM. Applications of SELDI-MS technology in oncology. J Cell Mol Med. 2008;12:1535–1547. - PMC - PubMed
    1. Petricoin EF, Liotta LA. SELDI-TOF-based serum proteomic pattern diagnostics for early detection of cancer. Curr Opin Biotechnol. 2004;15:24–30. - PubMed
    1. Liu XP, Shen J, Li ZF, Yan L, Gu J. A serum proteomic pattern for the detection of colorectal adenocarcinoma using surface enhanced laser desorption and ionization mass spectrometry. Cancer Invest. 2006;24:747–753. - PubMed

Publication types

MeSH terms