Review
. 2011 May 17;27(10):5719-38.
doi: 10.1021/la103301d. Epub 2010 Nov 19.

Recent advances in colloidal and interfacial phenomena involving liquid crystals

Affiliations
Review

Recent advances in colloidal and interfacial phenomena involving liquid crystals

Yiqun Bai et al. Langmuir. .

Abstract

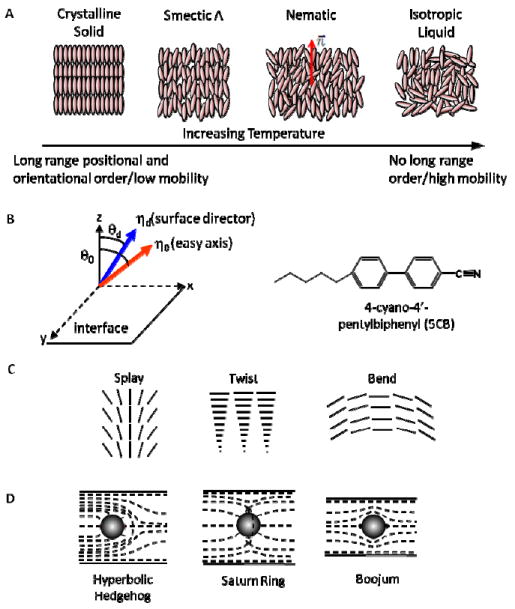
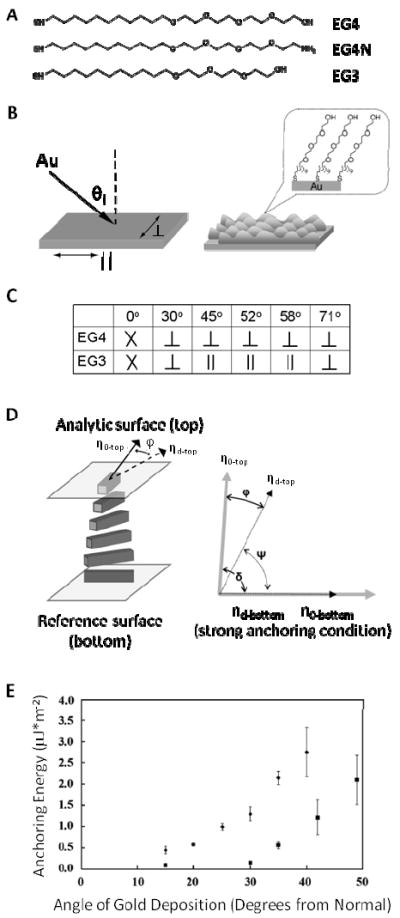
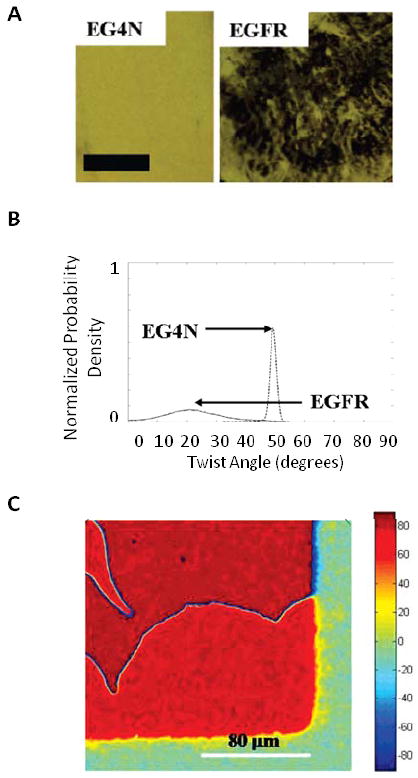
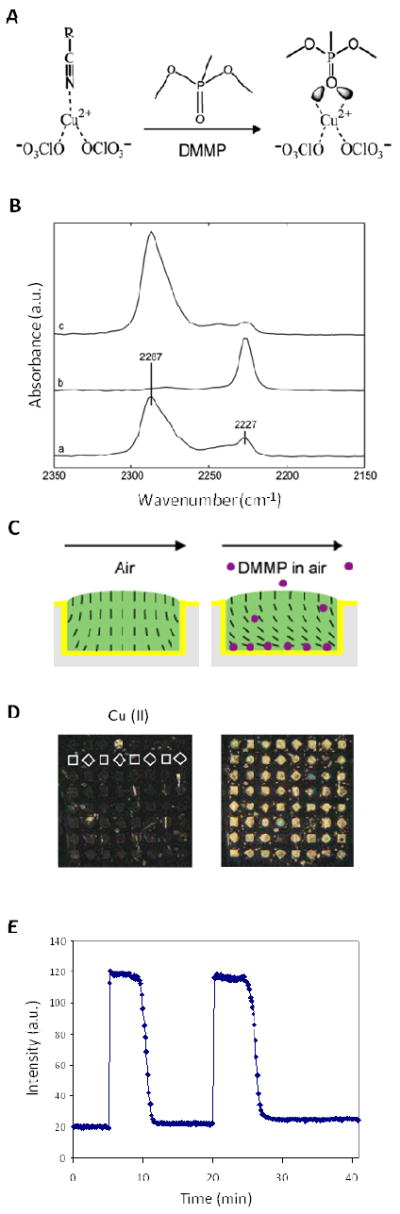
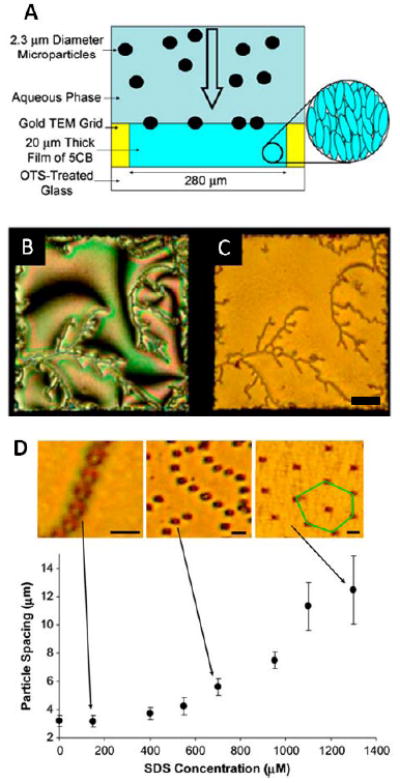
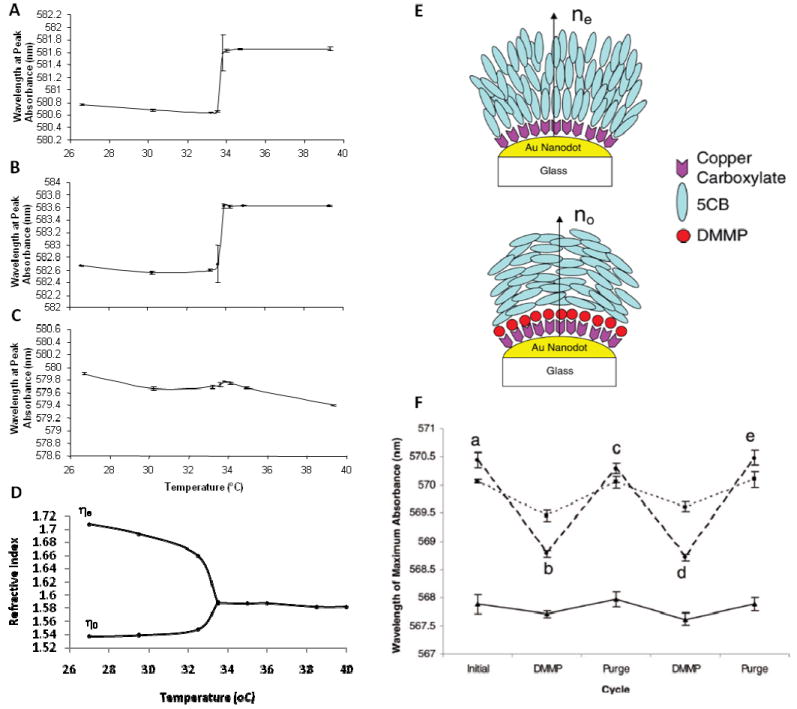
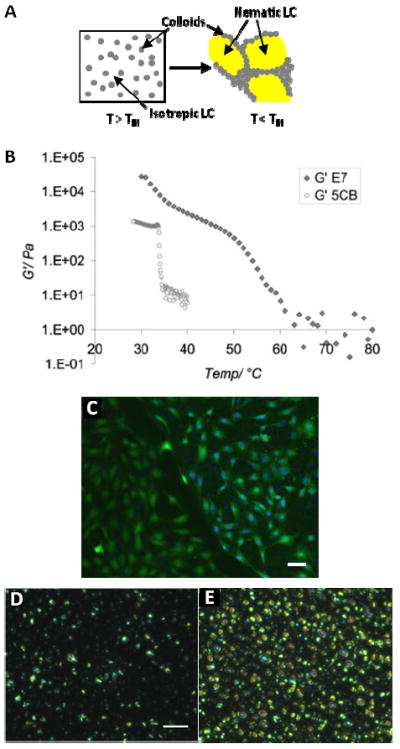
This feature article describes recent advances in several areas of research involving the interfacial ordering of liquid crystals (LCs). The first advance revolves around the ordering of LCs at bio/chemically functionalized surfaces. Whereas the majority of past studies of surface-induced ordering of LCs have involved surfaces of solids that present a limited diversity of chemical functional groups (surfaces at which van der Waals forces dominate surface-induced ordering), recent studies have moved to investigate the ordering of LCs on chemically complex surfaces. For example, surfaces decorated with biomolecules (e.g., oligopeptides and proteins) and transition-metal ions have been investigated, leading to an understanding of the roles that metal-ligand coordination interactions, electrical double layers, acid-base interactions, and hydrogen bonding can play in the interfacial ordering of LCs. The opportunity to create chemically responsive LCs capable of undergoing ordering transitions in the presence of targeted molecular events (e.g., ligand exchange around a metal center) has emerged from these fundamental studies. A second advance has focused on investigations of the ordering of LCs at interfaces with immiscible isotropic fluids, particularly water. In contrast to prior studies of surface-induced ordering of LCs on solid surfaces, LC-aqueous interfaces are deformable and molecules at these interfaces exhibit high levels of mobility and thus can reorganize in response to changes in the interfacial environment. A range of fundamental investigations involving these LC-aqueous interfaces have revealed that (i) the spatial and temporal characteristics of assemblies formed from biomolecular interactions can be reported by surface-driven ordering transitions in the LCs, (ii) the interfacial phase behavior of molecules and colloids can be coupled to (and manipulated via) the ordering (and nematic elasticity) of LCs, and (iii) the confinement of LCs leads to unanticipated size-dependent ordering (particularly in the context of LC emulsion droplets). The third and final advance addressed in this article involves interactions between colloids mediated by LCs. Recent experiments involving microparticles deposited at the LC-aqueous interface have revealed that LC-mediated interactions can drive interfacial assemblies of particles through reversible ordering transitions (e.g., from 1D chains to 2D arrays with local hexagonal symmetry). In addition, recent single-nanoparticle measurements suggest that the ordering of LCs about nanoparticles differs substantially from micrometer-sized particles and that the interactions between nanoparticles mediated by the LCs are far weaker than predicted by theory (sufficiently weak that the interactions are reversible and thus enable self-assembly). Finally, LC-mediated interactions between colloidal particles have also been shown to lead to the formation of colloid-in-LC gels that possess mechanical properties relevant to the design of materials that interface with living biological systems. Overall, these three topics serve to illustrate the broad opportunities that exist to do fundamental interfacial science and discovery-oriented research involving LCs.


Figures

Figure 1
Figure 1
(A) Schematic illustration of temperature-dependent phases of materials that form LCs. (B) (left) Orientation of the director and easy axis of LC at a surface; (right) Chemical structure of 5CB. (C) Schematic illustration of three modes of strain of LCs: (i) splay, (ii) twist, and (iii) bend. (D) Schematic illustration of the director near particles inserted into LCs.
Figure 2
Figure 2
(A) Chemical structures of three different ethylene glycol-terminated thiols that form SAMs on gold. (B) Schematic illustrations of the oblique deposition of gold films and the formation of SAMs on the films. (C) Orientations of the easy axes of nematic 5CB anchored on SAMs formed from EG3 or EG4 thiols. The “X” indicates degenerate alignment of the LC. (D) Schematic of a twisted nematic liquid crystal (TNLC) cell to measure the azimuthal anchoring energy of the LC at a surface. (E) Dependence of the azimuthal anchoring energy of nematic 5CB on the angle of deposition, for gold films supporting SAMs formed from either EG4N (squares) or EG4 (diamonds). Error bars indicate 95% confidence intervals for at least 3 samples. Adapted with permission from Lowe, A. M.; Ozer, B. H.; Bai, Y.; Bertics, P. J.; Abbott, N. L., Applied Materials and Interfaces 2010, 2, 722-731. Copyright (2010) American Chemical Society, and Clare, B. H.; Guzman, O.; de Pablo, J. J.; Abbott, N. L., Langmuir 2006, 22, 4654-4659. Copyright (2006) American Chemical Society.
Figure 3
Figure 3
(A) Optical micrographs of nematic 5CB on gold films that were deposited at an oblique angle of deposition (35° from normal) and subsequently functionalized with (left) a SAM formed from EG4N, or (right) a SAM formed from EG4N onto which EGFR was deposited by affinity contact printing. Scale bar = 1mm. (B) Normalized distribution of twist angles corresponding to the optical images in (A). (C) High resolution map of the twist angle of a twisted nematic liquid crystal (TNLC) in contact with a surface patterned with SAMs formed from pentadecanethiol (C15) (red) or hexadecanethiol (C16) (green). Colors correspond to twist angles of the LC shown on color chart at right side of the figure. Adapted with permission from Lowe, A. M.; Ozer, B. H.; Bai, Y.; Bertics, P. J.; Abbott, N. L., Applied Materials and Interfaces 2010, 2, 722-731. Copyright (2010) American Chemical Society, and Lowe, A. M.; Bertics, P. J.; Abbott, N. L., Analytical Chemistry 2008, 80, 2637-2645. Copyright (2008) American Chemical Society
Figure 4
Figure 4
(A) Schematic illustration of the competitive molecular interactions between copper(II) perchlorate, the nitrile group of 5CB, and the phosphoryl group of DMMP. (B) PM-IRRAS spectra of a thin film of 8CB on a carboxylic acid-terminate SAM supporting copper (II) perchlorate salts (a) before and (b) during exposure to 10 ppm DMMP and (c) after a 30-min air purge. (C) Cartoon of the microwells used to house the LC. (D) Optical images (crossed polars) of 5CB supported on Cu2+ perchlorate salts hosted within an array of wells (depth of ~2.8 μm, width of 500 μm) (left) before and (right) during exposure to 10 ppm DMMP in nitrogen for 5 min. White outlines indicate the location of a single row of LC-filled wells in the left image. (E) Plot of the optical response of the LC upon exposure to DMMP, showing the reversible nature of the ordering transition. Adapted with permission from Cadwell, K. D.; Alf, M. E.; Abbott, N. L., J Phys Chem B 2006, 110, 26081-26088. Copyright (2006) American Chemical Society
Figure 5
Figure 5
(A) Schematic illustration of the experimental system used to create stable LC-aqueous interfaces. (B) Optical image and cartoon representation of the anchoring of 5CB and the state of the aqueous- 5CB interface immediately after injection of a dispersion of vesicles formed from 0.1mM LDLPC in tris-buffered saline (TBS) (aqueous 10mM Tris, 100mM NaCl; pH 8.9). The optical image above the cartoon shows the transmission of polarized light (cross polars) through the 5CB. Scale bar, 200μm. (C) Optical image and cartoon representation of the anchoring of 5CB after ~10 to 20min of contact with the dispersion of L-DLPC vesicles. (D) Optical image and cartoon representation of the anchoring of 5CB after 2 hours of contact with the vesicle dispersion of L-DLPC vesicles. (E) Chemical structures of linear dodecyl-benzenesulfonate (L-DBS) and branched dodecylbenzene-sulfunate (BRDBS). (F) Structures of FTMA and oxidized FTMA and the proposed configuration at the air-water interface. Adapted with permission from Gupta, J. K.; Tjipto, E.; Zelikin, A. N.; Caruso, F.; Abbott, N. L., Langmuir 2008, 24, 5534-5542. Copyright (2008) American Chemical Society, and Brake, J. M.; Daschner, M. K.; Luk, Y. Y.; Abbott, N. L., Science 2003, 302, 2094-2097. Copyright (2003) AAAS.
Figure 6
Figure 6
Optical images (crossed polarizer) of 5CB (A-C) showing PLA2 interaction with monolayers of D-DPPC. (A) Optical image of 5CB after 16 hr of exposure to 1nM PLA2 in TBS-Ca2+. (B) Optical image of 5CB after 16 hr exposure to 100nM PLA2 in TBS-Ca2+. (C) Optical image of 5CB after 16 hr exposure to 100nM PLA2 in TBS-EDTA. (D) Schematic illustration of PLA2 bound to D-DPPC thus perturbing the anchoring of the LC. (E-H) Mixed L-DLPC (98%) and Bi-X-DPPE (2%) monolayers were formed at the aqueous-5CB interface. The mixed monolayer was placed into contact with phosphate buffered saline (PBS) at pH 7.4 containing [(E) to (G)] 500 nM fluorescein-labeled NeutrAvidin or (H) 500nM NeutrAvidin that has been blocked with biotin. The optical texture of 5CB was imaged by [(E) and (F)] polarized white light with the sample located between cross polars and (F) white light without polarizers. The bright domains in (E) correspond to tilted or planar orientations of the LC at the interface between the LC and aqueous phase, and the black regions correspond to a homeotropic orientation. (G) Fluorescein-labeled NeutrAvidin associated with the lipid-laden aqueous- 5CB interface imaged by epifluorescence microscopy. (H) 500nM NeutrAvidin blocked with soluble biotin in solution. Scale bars 150μm. Adapted from Brake, J. M.; Daschner, M. K.; Luk, Y. Y.; Abbott, N. L., Science 2003, 302, 2094-2097. Copyright (2003) AAAS, and Brake, J. M.; Abbott, N. L., Langmuir 2007, 23, 8497-8507. Copyright (2007) American Chemical Society.
Figure 7
Figure 7
(A-B) Schematic illustration of the proposed mechanism by which PLA2 catalyzes the hydrolysis of L-DLPC at the LC-aqueous interface leading to an ordering transition in the LC. (A) PLA2 binds to the phospholipids at the LC-aqueous interface only in the presence of Ca2+. (B) Bound PLA2 hydrolyzes L-phospholipids, forming single-tailed lysophospholipids and fatty acids that desorb from the interface. (C-E) Polarized light micrographs showing the interface of nematic 5CB decorated with LDLPC (doped with 1% TR-DHPE) following contact with an aqueous solutions containing 1nM PLA2, (C) 0, (D) 45, and (E) 90 min. Scale bar, 150μm. Adapted from Brake, J. M.; Daschner, M. K.; Luk, Y. Y.; Abbott, N. L., Science 2003, 302, 2094-2097. Copyright (2003) AAAS, and Brake, J. M.; Abbott, N. L., Langmuir 2007, 23, 8497-8507. Copyright (2007) American Chemical Society.
Figure 8
Figure 8
(A, C) Optical images (crossed polarizers) and (B, D) corresponding fluorescent images of LDLPC laden aqueous-5CB interfaces prepared by adsorption of lipid for 10 min from a 10μM unilamellar vesicle solution of L-DLPC doped with 0.1% Texas-Red-DPPE. (A, B) Nematic 5CB with a L-DLPC-laden interface. (C, D) Images of the samples in (A, B) heated to 34°C and equilibrated at that temperature for 2 hr. (E-G) Optical images of lipid-decorated film of nematic 5CB with thicknesses (E) 5μm, (F) 20μm, and (G) 40μm. (H) Plot of dimensionless free energy versus mole fraction of lipid at the aqueous-5CB interface in the presence (E=0.005; W = ∞ or W = 10-6 J/m2)/ absence (E = 0; ΔGLC = 0) of elastic energy for χ = 2. E is the dimensionless elastic energy calculated as Kπ2A*/ 8DkBT, where K is the temperature-dependent elastic constant of the LC, A* is the area per lipid molecule at saturation coverage, D is the thickness of the film of LC, kB is the Boltzmann constant, and T is temperature. (See text for details). Inset: Phase diagram of lipid at aqueous-LC interface for the case of strong (W = ∞) and weak (W = 10-6 J/m2). Adapted with permission from Gupta, J. K.; Meli, M. V.; Teren, S.; Abbott, N. L., Physical Review Letters 2008, 100, 048301. Copyright (2008) by the American Physical Society.
Figure 9
Figure 9
(A) Preparation of LC droplets of predetermined sizes within polymeric multilayer “shells”. Polymeric shells were prepared by sequential deposition of PSS and PAH onto silica templates and subsequent etching of silica. The resulting polymeric shells were filled with LCs (see text for details). (B) Chemical structures of the polymers used to create polymeric multilayer shells. (C) Bright-field micrographs of polymer-encapsulated 5CB droplets obtained using silica templates with diameters of 10± 0.22 μm, 8 ± 0.20 μm, 5 ± 0.19 μm, 1 ± 0.04 μm, 0.7 ± 0.08 μm, respectively. All scale bars, 3μm. Adapted with permission from Gupta, J. K.; Sivakumar, S.; Caruso, F.; Abbott, N. L., Angew Chem Int Ed 2009, 48, 1652-1655. Copyright (2009) by Wiley-InterScience.
Figure 10
Figure 10
(A) Bipolar and (B) homogeneous director configurations within LC droplets. (C-F) Polarized optical micrographs of polymer-encapsulated 5CB droplets. (C) Diameter 8.0 ± 0.2 μm with bipolar ordering. (D, E) Diameter 1.0 ± 0.2 μm with pre-radial ordering. (F) Diameter 0.70 ± 0.08 μm with radial ordering. (G-I) Cartoons of bipolar, pre-radial, and radial ordering of the LC droplets. Scale bars, 2μm for C-E, 1μm for F. Reprinted with permission from Gupta, J. K.; Sivakumar, S.; Caruso, F.; Abbott, N. L., Angew Chem Int Ed 2009, 48, 1652-1655. Copyright (2009) by Wiley-InterScience.
Figure 11
Figure 11
(A) Surface-driven ordering transitions of LC droplets of fixed size. The change in surface anchoring of the LC droplet (from tangential to perpendicular) was achieved by equilibrating 8.0 ± 0.2 μm diameter, polymer-encapsulated 5CB droplets with aqueous solutions containing SDS at concentrations that ranged from 0 to 1 mM. Top row: schematic illustrations of the topological ordering of the LC within each droplet. Bottom row: corresponding polarized light micrographs of the 5CB droplets. (B) Size-dependent response of polymer-encapsulated LC droplets to concentration of SDS. The SDS concentration (c) that causes radial ordering of the LC droplet is plotted as a function of droplet diameter (d). Adapted with permission from Gupta, J. K.; Sivakumar, S.; Caruso, F.; Abbott, N. L., Angew Chem Int Ed 2009, 48, 1652-1655. Copyright (2009) by Wiley-InterScience, and Gupta, J. K.; Zimmerman, J. S.; de Pablo, J. J.; Caruso, F.; Abbott, N. L., Langmuir 2009, 25, 9016-9024. Copyright (2009) from the American Chemical Society.
Figure 12
Figure 12
(A, E) Schematic illustrations of nematic 5CB confined within a specimen grid supported on OTS-treated glass surfaces. The orientation of the nematic 5CB at the interface to the aqueous phase is shown to be parallel to the interface in (A) (planar) and perpendicular to the interface in (F) (homeotropic). (B,C) Micrographs of a DMOAP-treated microparticle at the 5CB-aqueous interface using (B) polarized and (C) bright-field imaging. Illustration of the side view (D) of the LC orientation surrounding a single DMOAP-treated microparticle when the orientation of 5CB at the 5CB-aqueous interface was planar. (F, G) Micrographs of a DMOAP-treated microparticle at the 5CB-aqueous interface using (F) polarized and (G) bright-field imaging. Illustration of the side view (H) of the LC orientation surrounding a single DMOAP-treated microparticle when the orientation of 5CB at the 5CBaqueous interface was homeotropic. Scale bars, 2μm. Adapted from Koenig, G. M. J.; Lin, I. H.; Abbott, N. L., PNAS 2010, 107, 3998-4003.
Figure 13
Figure 13
(A) Cartoon depicting the sedimentation microparticles onto an interface formed between nematic 5CB and an aqueous phase. (B,C) Interfacial assemblies of microparticles with areal densities of 4,500 microparticles/mm2 visualized using (B) polarized and (C) bright-field microscopy. (D) Centerto-center, nearest-neighbor spacing of microparticles within chains of microparticles formed at the LCaqueous interface, plotted as a function of the concentration of SDS in the aqueous phase. Images are bright-field micrographs of microparticles at the nematic 5CB-aqueous interface with aqueous phase SDS concentrations of 150, 700, and 1,300 μM. Scale bars, 50μm for C, 5μm for D. Adapted from Koenig, G. M. J.; Lin, I. H.; Abbott, N. L., PNAS 2010, 107, 3998-4003.
Figure 14
Figure 14
(A-C) Temperature dependence of the LSPR peak of gold nanoparticles functionalized with (A) decanethiol, (B) hexadecanethiol, (C) 8:2 mixture of decanethiol and hexadecanethiol. The measurements were performed with the surface-immobilized nanoparticles in contact with 5CB. Prior to chemical functionalization, the peak absorbance was measured in air to occur at 546.7 nm. (D) Ordinary (n0) and extraordinary (ne) refractive indices of 5CB as a function of temperature for light with a wavelength of 589 nm. (E) Schematic illustration of the local ordering of 5CB near the surface of copper carboxylate-functionalized gold nanoparticles before and after exposure to DMMP. (F) (--) LSPR responses following exposure of the film of 5CB to (a) air (b) 10 ppm DMMP, (c) re-exposure to air, (d) re-exposure to 10 ppm DMMP, and (e) re-exposure to air. (▪▪) LSPR response to DMMP with the bulk 5CB heated into the isotropic phase. (—) LSPR response using an isotropic oil rather than 5CB. Adapted from Koenig, G. M. J.; Meli, M. V.; Park, J. S.; de Pablo, J. J.; Abbott, N. L., Chem Mater 2007, 19, 1053-1061. Copyright (2007) American Chemical Society, and Koenig, G. M. J.; Gettlefinger, B. T.; de Pablo, J. J.; Abbott, N. L., Nanoletters 2008, 8, 2362-2368. Copyright (2008) American Chemical Society.
Figure 15
Figure 15
(A) Schematic illustration of the formation of colloidal networks upon cooling of mesogens below the nematic-to-isotropic transition temperature (TNI). (B) Storage moduli of the CLC composites made with 15 wt% polystyrene (PS) particles (1 μm diameter) suspended in E7 or 5CB. (C) Cells stained with calcein-AM and Hoescht stain, on CLC or on glass coverslip around CLC (scale bar = 50 μm). (D) CLC gel exposed to DMMP at 0 seconds, and (E) 80 seconds. (scale bar = 30μm). Adapted with permission from Agarwal, A.; Huang, E.; Palecek, S.; Abbott, N. L., Advanced Materials 2008, 20, 4804-4809. Copyright (2008) Wiley-InterScience, and Pal, S. K.; Agarwal, A.; Abbott, N. L., Small 2009, 5, 2589-2596. Copyright (2009) Wiley-InterScience.

Similar articles

Cited by

References

    1. de Gennes PG, Prost J. The Physics of Liquid Crystals. Oxford University Press; London: 1994.
    1. Collings PJ, Hird M. Introduction to Liquid Crystals. Taylor & Francis Ltd; 1997.
    1. Jerome B. Rep Prog Phys. 1991;54:391–451.
    1. Gupta VK, Abbott NL. Physical Review E. 1996;54:4540–4543. - PubMed
    1. Lockwood NA, Gupta JK, Abbott NL. Surface Science Reports. 2008;63:255–293.

Publication types