. 2010 Dec;78(5):1313-23.
doi: 10.1111/j.1365-2958.2010.07408.x. Epub 2010 Oct 12.

Chemoreceptors in signalling complexes: shifted conformation and asymmetric coupling

Affiliations

Chemoreceptors in signalling complexes: shifted conformation and asymmetric coupling

Divya N Amin et al. Mol Microbiol. 2010 Dec.

Abstract

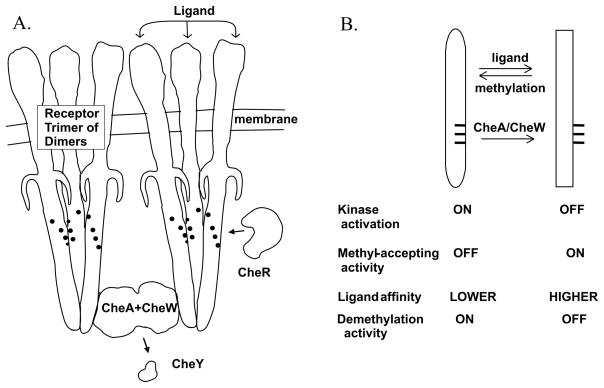
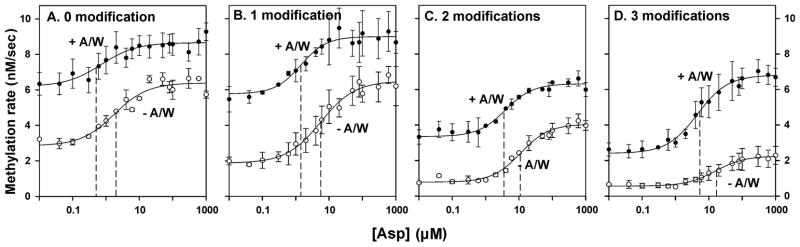
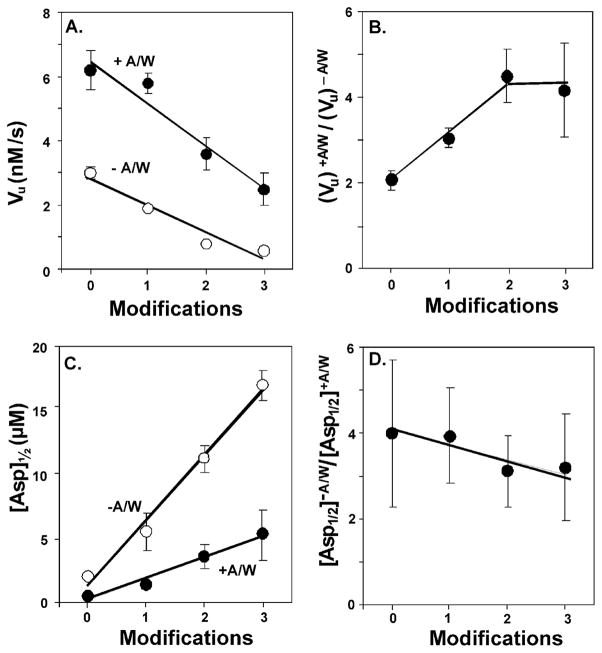
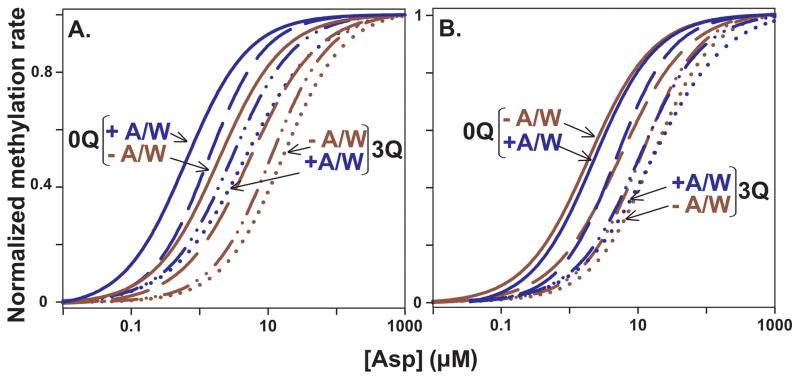
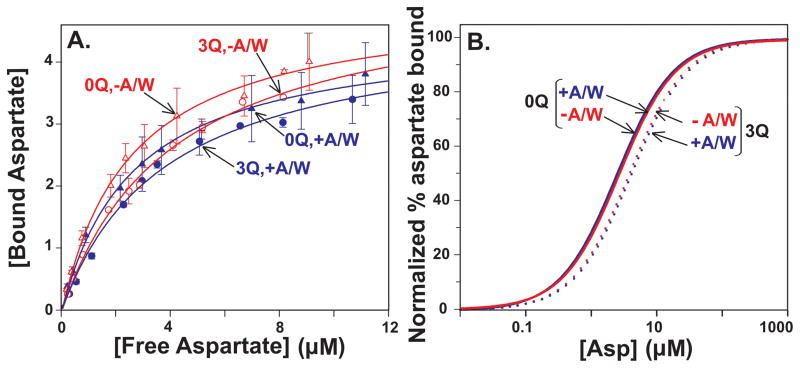
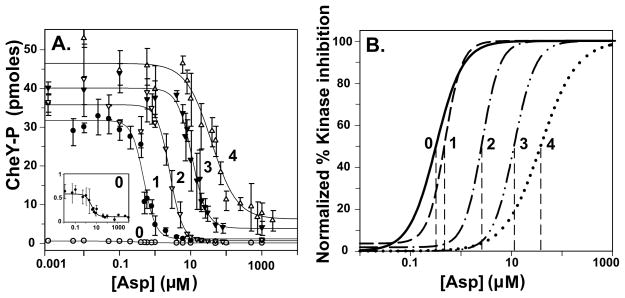
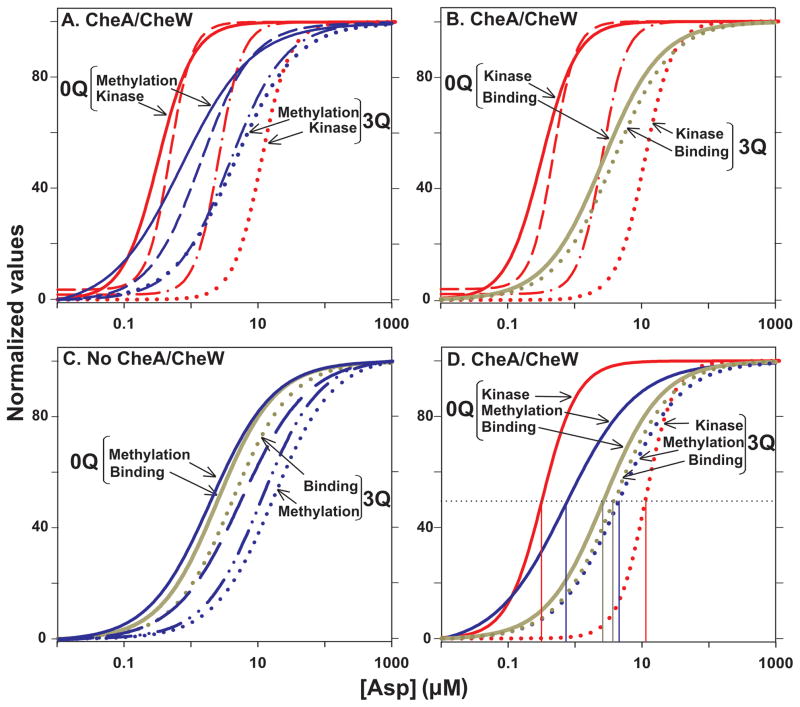
Bacterial chemotaxis is mediated by signalling complexes of chemoreceptors, histidine kinase CheA and coupling protein CheW. Interactions in complexes profoundly affect the kinase. We investigated effects of these interactions on chemoreceptors by comparing receptors alone and in complexes. Assays of initial rates of methylation indicated that signalling complexes shifted receptor conformation towards the methylation-on, higher-ligand-affinity, kinase-off state, tuning receptors for greater sensitivity. In contrast, transmembrane and conformational signalling within chemoreceptors was essentially unaltered, consistent with other evidence identifying receptor dimers as the fundamental units of such signalling. In signalling complexes, coupling of ligand binding to kinase activity is cooperative and the dynamic range of kinase control expanded > 100-fold by receptor adaptational modification. We observed no cooperativity in influence of ligand on receptor conformation, only on kinase activity. However, receptor modification generated increased dynamic range in a stepwise fashion, partly in coupling ligand to receptor conformation and partly in coupling receptor conformation to kinase activity. Thus, receptors and kinase were not equivalently affected by interactions in signalling complexes or by ligand binding and adaptational modification, indicating asymmetrical coupling between them. This has implications for mechanisms of precise adaptation. Coupling might vary, providing a previously unappreciated locus for sensory control.


Figures

Fig. 1
Fig. 1. Chemoreceptors and signaling complexes
A. Core unit of chemotaxis signaling complexes. The cartoon shows two trimers of chemoreceptor dimers in complex with CheA and CheW in an organization consistent with recent models (Khursigara et al., 2008, Bhatnagar et al., 2010, Erbse & Falke, 2009). Also shown are two soluble chemotaxis proteins relevant to this study, methyltransferase CheR and response regulator CheY, and the positions of methyl-accepting sites (black dots on receptors). B. Diagram of the chemoreceptor conformational equilibrium. The diagram lists relevant features of the two conformations and the parameters that influence the equilibrium between them. The indicated influence of signaling complexes (CheA/CheW) on receptor conformation is documented in the current study.
Fig. 2
Fig. 2. Initial rates of methylation as a function of adaptational modification and ligand concentration
Rates were determined for Tar embedded in native membrane vesicles, carrying 0 (EEEE, 0 modification), 1 (QEEE, 1 modification), 2 (QEQE, 2 modifications) or 3 (QEQQ, 3 modifications) glutamines at the indicated aspartate concentrations and in the absence of CheA, CheW and CheY (−A/W, open circles) or in their presence in conditions that produced maximum kinase activation and thus the maximal level of functional signaling complexes (+A/W, solid circles). The plots show means (circles) and standard deviations (error bars) for ≥3 independent experiments. The curves are fits of the data to a simple dose-response relationship (Table 1, legend). The dashed lines show the respective values for [Asp]½.
Fig. 3
Fig. 3. Effects of adaptational modification on parameters derived from dose-response curves
A. Means (circles) and standard deviations (error bars) for vu, initial velocity of methylation, derived from the fits of the data in Fig. 2 (see Table 1) plotted as a function of adaptational modification for Tar in the absence (−A/W, open circles) or presence (+A/W, solid circles) of signaling complexes. Lines are least square fits of the data. B. Ratios of vu in the presence (vu)+A/W versus the absence (vu)−A/W of the other components of signaling complexes. Error bars represent uncertainties estimated by error propagation. The line is presented to aid the eye. C. Means (circles) and standard deviations (error bars) for [Asp]½, derived from the fits of the data in Fig. 2 (see Table 1) plotted as a function of adaptational modification for Tar in the absence (−A/W, open circles) or presence (+A/W, solid circles) of signaling complexes. Lines are least square fits of the data. D. Ratios of [Asp]½ in the presence ([Asp]½ +A/W) versus the absence ([ASP]½−A/W) of the other components of signaling complexes. Error bars represent uncertainties estimated by error propagation. The line is a least square fit of the data.
Fig. 4
Fig. 4. Normalized fits of initial rates of methylation data as a function of adaptational modification and ligand concentration
A. The dose-response curves fitted to the data in Fig. 2 were normalized to their respective vu and vs values. Curves for 0 (solid), 1 (dashed), 2 (dot-dash) and 3 (dotted) receptor modifications (0Q, 1Q, 2Q and 3Q) are shown for Tar in the absence (−A/W, red) and presence (+A/W, blue) of CheA/CheW plus CheY to form signaling complexes. Only the 0Q and 3Q curves are labeled. B. The two sets of curves shown in Fig. 4A (−A/W, red and +A/W, blue) were aligned using the respective [Asp]½ values for Tar(2Q). Labels are as for Fig. 4A.
Fig. 5
Fig. 5. Aspartate binding by Tar as a function of adaptational modification and ligand concentration
A. Binding of radiolabeled aspartate to Tar embedded in native membrane vesicles and carrying 0 (EEEE, 0Q, triangles) or 3 (QEQQ, 3Q, circles) glutamines in the absence (−A/W, red, open symbols) or presence (+A/W, blue, solid symbols) of the other components of core signaling complexes plus CheY in conditions that produced maximum kinase activation and thus the highest level of functional signaling complexes. The plots show means (symbols) and standard deviations (error bars) for ≥3 independent experiments. The curves are fits of the data to a simple dose-response relationship (Experimental Procedures). Respective [Asp]½ values derived from these fits were −A/W: 0Q = 2.8 ± 0.1, 3 Q = 3.5 ± 0.9; +A/W: 0Q = 2.7 ± 0.5, 3 Q = 3.9 ± 0.3. B. Curves shown in Fig. 5A normalized to their respective maximal binding values.
Fig. 6
Fig. 6. Initial rates of phosphorylation as a function of adaptational modification and ligand concentration
Rates were determined for the forms of Tar used for the experiments shown in Fig. 2 plus Tar4Q (QQQQ) at the indicated aspartate concentrations in the presence of CheA/CheW in conditions that produced maximum kinase activation and thus the highest level of functional signaling complexes. The plots show means (circles) and standard deviations (error bars) for ≥3 independent experiments. The curves are fits of the data to a simple dose-response relationship (Table 2, legend). B. Curves in Fig. 6A normalized to their respective maximal and minimal values. The dashed lines show the respective values for [Asp]½.
Fig. 7
Fig. 7. Comparison of dose-response curves
The normalized curves for initial rate of methylation from Fig 4A (Methylation), aspartate binding from Fig. 5B (Binding) and kinase activity from Fig. 6B (Kinase) as a function of aspartate concentration are compared in selected groupings. A. Comparison of initial rates of Tar methylation and kinase activity in conditions generating maximal formation of signaling complexes. Curves are shown for Tar with 0 to 3 modifications but only the extremes are labeled. B. Comparison of aspartate binding and kinase activity in conditions generating maximal formation of signaling complexes. Only the extremes of adaptational modification, no glutamines (0Q) and three glutamines (3Q) are labeled but curves are also shown for kinase activity with Tar carrying 1 and 2 modifications. C. Comparison of aspartate binding and initial rates of methylation for Tar in the absence of signaling complexes. As for Fig. 7A, only the extremes of adaptational modification, no glutamines (0Q) and three glutamines (3Q) are labeled but curves are also shown for initial rates of methylation activity with Tar carrying 1 and 2 modifications. D. Comparison of aspartate binding, initial rates of Tar methylation and kinase activity as a function of aspartate concentration in conditions generating maximal formation of signaling complexes. Curves are shown for Tar with 0 and 3 modifications, labeled as for the other panels. The thin vertical lines show the respective values for [Asp]½.

Similar articles

Cited by

References

    1. Alon U, Surette MG, Barkai N, Leibler S. Robustness in Bacterial Chemotaxis. Nature. 1999;397:168–171. - PubMed
    1. Amin DN, Hazelbauer GL. The Chemoreceptor Dimer Is the Unit of Conformational Coupling and Transmembrane Signaling. J Bacteriol. 2010;192:1193–1200. - PMC - PubMed
    1. Barnakov A, Barnakova L, Hazelbauer G. Comparison in vitro of a high- and a low-abundance chemoreceptor of Escherichia coli: similar kinase activation but different methyl-accepting activities. J Bacteriol. 1998;180:6713–6718. - PMC - PubMed
    1. Barnakov AN, Barnakova LA, Hazelbauer GL. Efficient adaptational demethylation of chemoreceptors requires the same enzyme-docking site as efficient methylation. Proc Natl Acad Sci USA. 1999;96:10667–10672. - PMC - PubMed
    1. Bhatnagar J, Borbat PP, Pollard AM, Bilwes AM, Freed JH, Crane BR. Structure of the Ternary Complex Formed by a Chemotaxis Receptor Signaling Domain, the CheA Histidine Kinase, and the Coupling Protein CheW As Determined by Pulsed Dipolar ESR Spectroscopy. Biochemistry. 2010;49:3824–3841. - PMC - PubMed

Publication types

MeSH terms