Comparative Study
. 2011 Apr;10(3):264-75.
doi: 10.1111/j.1601-183X.2010.00664.x. Epub 2010 Dec 16.

Intragastric self-infusion of ethanol in high- and low-drinking mouse genotypes after passive ethanol exposure

Affiliations
Comparative Study

Intragastric self-infusion of ethanol in high- and low-drinking mouse genotypes after passive ethanol exposure

T L Fidler et al. Genes Brain Behav. 2011 Apr.

Abstract

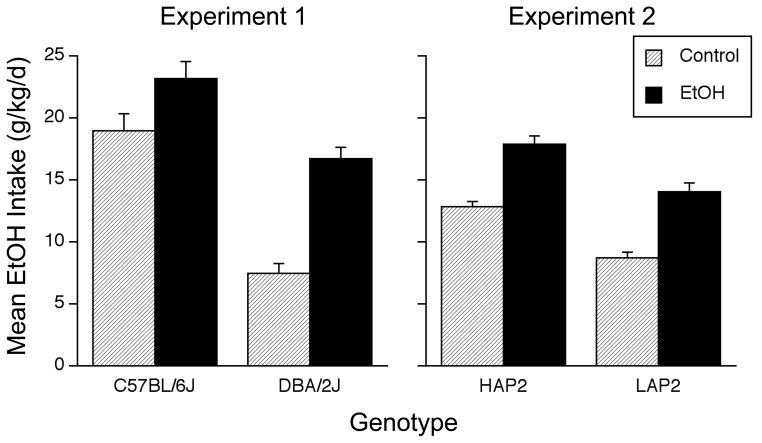
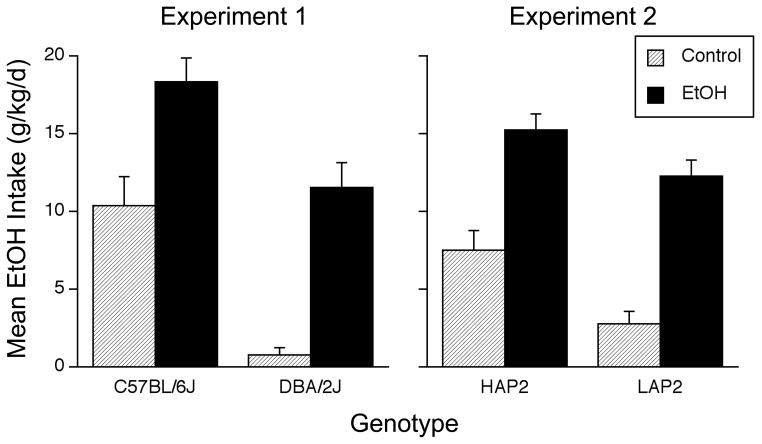
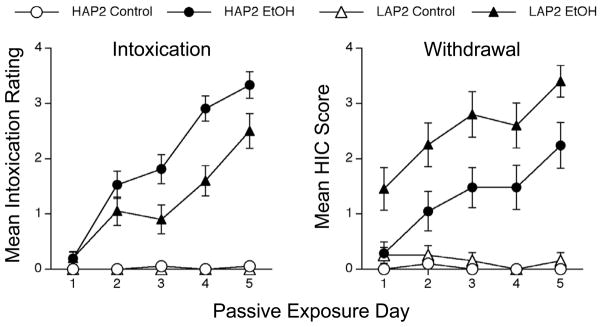
Two experiments examined the effect of 5 days of passive exposure to ethanol (or water) on later self-infusion of ethanol or water via surgically implanted intragastric (IG) catheters in mouse genotypes previously shown to drink high (C57BL/6J, HAP2) or low (DBA/2J, LAP2) amounts of ethanol in home-cage continuous-access two-bottle choice procedures. Intragastric ethanol self-infusion was affected by both genotype and a history of passive ethanol exposure, with greater intakes in the high-drinking genotypes and in groups that received passive exposure to ethanol. Passive ethanol exposure also increased preference for the flavor that signaled ethanol infusion (S+), eliminating genetic differences in this measure. The increases in ethanol intake and S+ preference induced by ethanol exposure might have been mediated jointly by development of tolerance to aversive post-absorptive ethanol effects and negative reinforcement because of alleviation of withdrawal. Bout analyses indicated that ethanol exposure increased ethanol self-infusion by increasing the total number of daily bouts rather than by increasing bout size. These analyses also showed that DBA/2J mice infused larger ethanol bouts and a greater percentage of their total intakes in large bouts than C57BL/6J mice. Overall, these studies suggest that the IG self-infusion procedure is a potentially useful new tool for studying genetic and environmental influences on excessive ethanol intake and preference in mice.


Figures

Figure 1
Figure 1
Mean (+SEM) daily ethanol intakes (g/kg/day) during the no-choice phase when only the S+ flavor (paired with infusion of ethanol) was available. The left panel shows intakes by C57BL/6J (B6) mice and DBA/2J (D2) mice (Experiment 1) and the right panel shows intakes by HAP2 and LAP2 mice (Experiment 2). Mice had previously received passive exposure to water (shaded bars) or EtOH (black bars). The Experiment 1 ANOVA yielded significant effects of Group, Genotype and their interaction. Post-hoc tests showed that the EtOH group infused more ethanol than the Control group for both strains and that B6 mice infused more ethanol than D2 mice in both groups. The Experiment 2 ANOVA yielded significant effects of Group and Genotype, but no interaction. The number of mice per group was 15–21 (see text for details).
Figure 2
Figure 2
Mean (+SEM) daily ethanol intakes (g/kg/day) during the choice phase in which mice could choose between drinking the S+ flavor (paired with infusion of ethanol) or the S− flavor (paired with infusion of water). The left panel shows intakes by C57BL/6J mice and DBA/2J mice (Experiment 1) and the right panel shows intakes by HAP2 and LAP2 mice (Experiment 2). Mice had previously received passive exposure to water (shaded bars) or EtOH (black bars). ANOVAs for each experiment revealed significant effects of Group and Genotype, but no interaction. The number of mice per group was 14–21 (see text for details).
Figure 3
Figure 3
Mean (+SEM) preference for the ethanol-paired flavor (S+) during the choice phase. Preference (expressed as a percentage of total licks) was calculated for each mouse by averaging preference ratios calculated separately for each choice day using the following formula: [(S+ Licks)/(S+ Licks) + (S− Licks)] * 100. The left panel shows intakes by C57BL/6J (B6) mice and DBA/2J (D2) mice (Experiment 1) and the right panel shows intakes by HAP2 and LAP2 mice (Experiment 2). Mice had previously received passive exposure to water (shaded bars) or EtOH (black bars). The Experiment 1 ANOVA yielded significant effects of Group, Genotype and their interaction. Post-hoc tests supported the following conclusions: B6 EtOH = B6 Control; D2 EtOH > D2 Control; B6 Control > D2 Control; B6 EtOH = D2 EtOH = 50%; B6 EtOH > 50%; D2 Control < 50%. The Experiment 2 ANOVA showed only a significant effect of Group. Post-hoc t-tests supported the following conclusions: HAP2 Control = 50%; LAP 2 Control < 50%; both EtOH groups > 50%. The number of mice per group was 14–21 (see text for details).
Figure 4
Figure 4
Mean (+SEM) intoxication ratings (left panel) and withdrawal HIC scores (right panel) for HAP2 (circles) and LAP2 (triangles) mice in Experiment 2. Mice had previously received passive exposure to water (open symbols) or EtOH (closed symbols). The ANOVA for intoxication ratings revealed significant effects of Genotype, Day and their interaction. Post-hoc tests indicated a Genotype difference between the EtOH groups on Days 3–5. The ANOVA for HIC scores yielded significant effects of Genotype and Day, but no interaction. The number of mice per group was 20–21.
Figure 5
Figure 5
Scatter plot showing the relationship between BEC (mg/ml) and choice ethanol-infusion intake (g/kg) during the 60 min before each sample was taken from mice at or near the 30-min self-infusion dose limit (see Methods for additional details). Squares = B6; Circles = D2; Diamonds = HAP-2; Triangles = LAP-2. Open symbols depict mice assigned to the Control groups; closed symbols depict mice assigned to the EtOH groups. The curve shows the least fit linear regression (r = +0.49, n = 37, p < 0.002).

References

    1. Becker HC, Lopez MF. Increased ethanol drinking after repeated chronic ethanol exposure and withdrawal experience in C57BL/6 mice. Alcohol Clin Exp Res. 2004;28:1829–1838. - PubMed
    1. Belknap JK, Belknap ND, Berg JH, Coleman R. Preabsorptive vs postabsorptive control of ethanol intake in C57BL/6J and DBA/2J mice. Behavior Genetics. 1977;7:413–425. - PubMed
    1. Belknap JK, Coleman RR, Foster K. Alcohol consumption and sensory threshold differences between C57BL/6J and DBA/2J mice. Physiological Psychology. 1978;6:71–74.
    1. Belknap JK, Crabbe JC, Young ER. Voluntary consumption of ethanol in 15 inbred mouse strains. Psychopharmacology. 1993;112:503–510. - PubMed
    1. Camarini R, Hodge CW. Ethanol preexposure increases ethanol self-administration in C57BL/6J and DBA/2J mice. Pharmacol Biochem Behav. 2004;79:623–632. - PubMed

Publication types

MeSH terms