. 2011 Mar;132(3):421-31.
doi: 10.1111/j.1365-2567.2010.03382.x. Epub 2010 Nov 23.

PD-1 negatively regulates interleukin-12 expression by limiting STAT-1 phosphorylation in monocytes/macrophages during chronic hepatitis C virus infection

Affiliations

PD-1 negatively regulates interleukin-12 expression by limiting STAT-1 phosphorylation in monocytes/macrophages during chronic hepatitis C virus infection

Cheng J Ma et al. Immunology. 2011 Mar.

Abstract

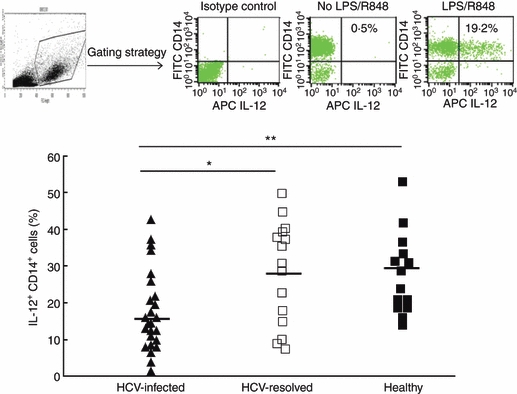
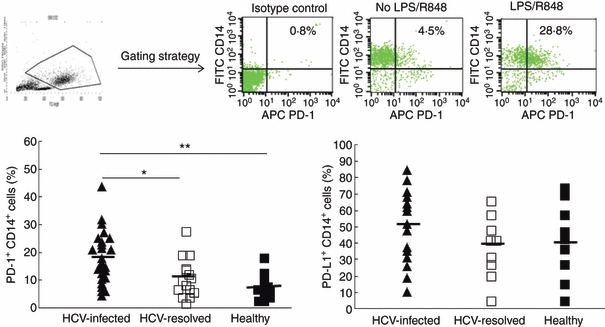
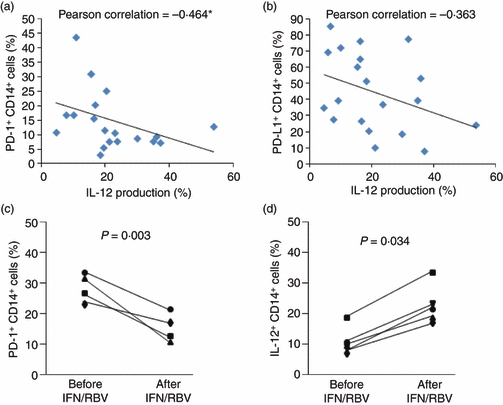
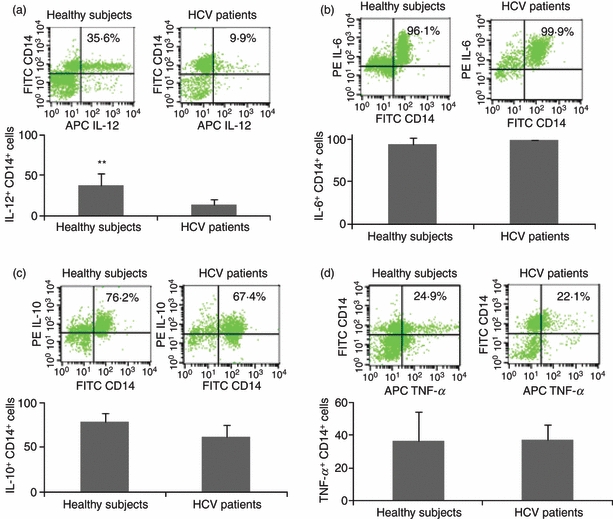
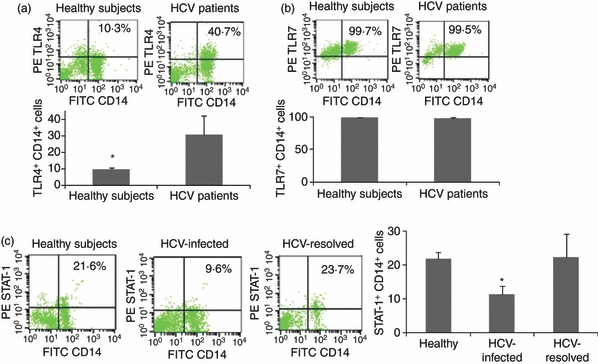
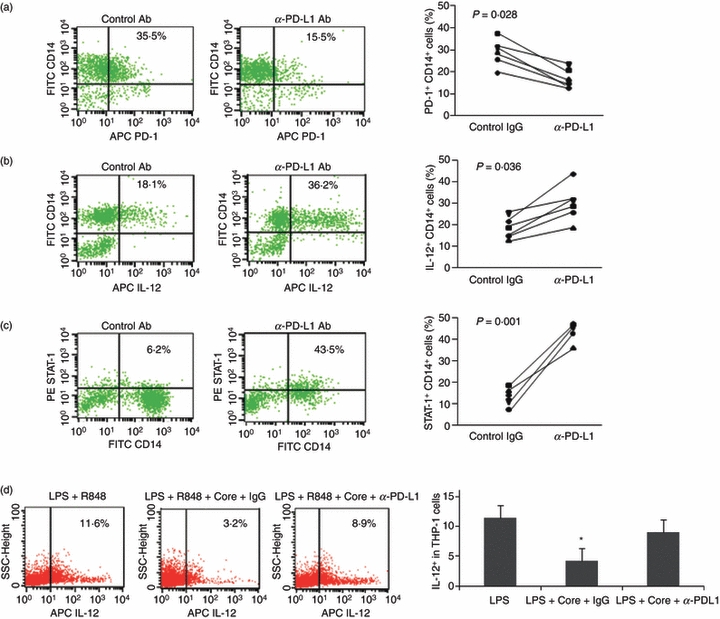
Hepatitis C virus (HCV) is remarkably efficient at evading host immunity to establish chronic infection. During chronic HCV infection, interleukin-12 (IL-12) produced by monocytes/macrophages (M/Mφ) is significantly suppressed. Programmed death-1 (PD-1), an inhibitory receptor on immune cells, plays a pivotal role in suppressing T-cell responses during chronic viral infection. To determine whether PD-1 regulates IL-12 production by M/Mφ during chronic HCV infection, we examined the expressions of PD-1, its ligand PDL-1, and their relationship with IL-12 production in M/Mφ from HCV-infected, HCV-resolved, and healthy subjects by flow cytometry. Toll-like receptor (TLR) -mediated IL-12 production by M/Mφ was selectively suppressed, while PD-1/PDL-1 expressions were up-regulated, in HCV-infected subjects compared with HCV-resolved or healthy subjects. Up-regulation of PD-1 was inversely associated with the degree of IL-12 inhibition in HCV infection. Interestingly, the reduced response of M/Mφ from HCV-infected individuals to TLR ligands appeared not to be the result of a lack of the ability to sense pathogen, but to an impaired activation of intracellular janus kinase/signal transducer and activator of transfection (STAT) pathway as represented by inhibited STAT-1 phosphorylation in M/Mφ from HCV-infected individuals compared with HCV-negative subjects. Successful HCV treatment with pegylated interferon/ribavirin or blocking PD-1/PDL-1 engagement ex vivo led to reduced PD-1 expression and improved IL-12 production as well as STAT-1 activation in M/Mφ from HCV-infected individuals. These results suggest that the PD-1 inhibitory pathway may negatively regulate IL-12 expression by limiting STAT-1 phosphorylation in M/Mφ during chronic HCV infection.


Figures

Figure 1
Figure 1
Interleukin-12 (IL-12) production is suppressed in CD14+ monocyte/macrophage (M/Mφ) during chronic hepatitis C virus (HCV) infection. Peripheral blood mononuclear cells from HCV-infected (▲, n = 25), HCV-resolved (□, n= 15), and healthy subjects (▪, n = 14) were stimulated with lipopolysaccharide (LPS) and R848 ex vivo, followed by cell surface staining for CD14 and intracellular staining for IL-12. The top panel shows the gating strategy for identifying M/Mφ subsets and representative flow cytometric isotype control (left) and dot plot (right) measuring IL-12 production in gated CD14+ M/Mφ with or without LPS/R848 stimulation. The percentage of IL-12-producing cells was calculated in CD14+ cell populations from the study subjects and plotted in the lower panel. Each symbol represents an individual subject, and the horizontal line demonstrates the mean of IL-12+ CD14+ M/Mφ. The P value is shown as *< 0·05, **< 0·01 above the group of study subjects.
Figure 2
Figure 2
Programmed death 1 (PD-1)/PD-1 ligand (PDL-1) expression is up-regulated on CD14+ monocyte/macrophages (M/Mφ) during chronic hepatitis C virus (HCV) infection. Peripheral blood mononuclear cells from HCV-infected (▲), HCV-resolved (□), and healthy subjects (▪) were stimulated with lipopolysaccharide (LPS) and R848 ex vivo, followed by cell surface double staining for CD14, PD-1, and PDL-1. The top panel shows the gating strategy for identifying M/Mφ subsets and representative flow cytometric isotype control (left) and dot plot (right) measuring PD-1 expression in gated CD14+ M/Mφ with or without Toll-like receptor (TLR) stimulation. The percentage of PD-1+ (left panel) or PDL-1+ (right panel) cells was calculated in CD14+ cell populations from the study subjects and plotted in the lower panel. Each symbol represents an individual subject, and the horizontal line demonstrates the mean of PD-1+ or PDL-1+ CD14+ M/Mφ. The P value is denoted as *< 0·05, **< 0·01 above the group of study subjects.
Figure 3
Figure 3
Programmed death 1 (PD-1) expression is inversely associated with interleukin-12 (IL-12) production by monocyte/macrophage (M/Mφ). M/Mφ from hepatitis C virus (HCV) -positive and -negative subjects were stimulated with lipopolysaccharide (LPS)/R848 as above followed by staining and flow cytometric analysis. The relationship between PD-1 (a) or PD-1 ligand (PDL-1) (b) expression and IL-12 production in M/Mφ was analysed by Pearson correlation using SPSS 18 software. The association of PD-1 expression and IL-12 production in M/Mφ was also longitudinally studied in HCV-infected subjects before and after antiviral treatment with interferon/ribavirin (IFN/RBV) with sustained virological response (c, n= 4, and d, n = 5). Paired Student's t-test was used to calculate P value here.
Figure 4
Figure 4
Interleukin-12 is selectively inhibited in monocyte/macrophage (M/Mφ) during hepatitis C virus (HCV) infection. M/Mφ from five HCV-infected and five healthy subjects were stimulated with lipopolysaccharide (LPS)/R848 as above followed by staining and flow cytometric analysis for the expressions of IL-12 (a), IL-6 (b), IL-10 (c), and tumour necrosis factor-α (TNF-α) (d). Representative dot plots with percentage of positive cells are shown above and summary data with bar figures are shown below. **P < 0·01.
Figure 5
Figure 5
Toll-like receptor (TLR) and phospho-signal transducer and activator of transcription 1 (STAT-1) expressions in monocyte/macrophage (M/Mφ) during hepatitis C virus (HCV) infection. M/Mφ from five HCV-infected and five HCV-uninfected subjects were stimulated with lipopolysaccharide (LPS)/R848 as above followed by staining and flow cytometric analysis for the expressions of TLR4 (a), TLR7 (b), and phospho-STAT-1 (c). Representative dot plots with percentage of positive cells as well as summary data with bar figures are shown. *P < 0·05.
Figure 6
Figure 6
Blocking the programmed death 1 (PD-1) inhibitory pathway reduces PD-1 expression and improves interleukin-12 (IL-12) production and signal transducer and activator of transcription 1 (STAT-1) activation. Peripheral blood mononuclear cells from hepatitis C virus (HCV) -infected individuals were pre-incubated with anti-PD-1 ligand (PDL-1) or a control antibody overnight; then stimulated with lipopolysaccharide (LPS) and R848 ex vivo for 72 hr, followed by flow cytometric analysis for the expressions of PD-1 (a), IL-12 (b), and phospho-STAT-1 (c). Left panel shows representative flow cytometric dot plots measuring PD-1 expression, IL-12 production, and STAT-1 phosphorylation in cells incubated with anti-PDL-1 blocking antibody or the control IgG. Right panel shows the combined data from all subjects tested comparing the effect of anti-PDL-1 to that of the IgG control. Each symbol represents an individual with chronic HCV infection. P-value is shown to compare PD-1 expression, IL-12 production, and STAT-1 phosphorylation in monocyte/macrophage treated with anti-PDL-1 versus control antibody. (d) To determine a direct effect of PD-1 blocking on monocytes, THP-1 cells were pre-incubated with or without PDL-1 or control IgG overnight, then stimulated with LPS/R848 in the presence or absence of HCV core protein, followed by FACS analysis of IL-12 expression. Representative dot plot and summary data from three repeated experiments are shown. *P < 0·05.

References

    1. Shepard CW, Finelli L, Alter MJ. Global epidemiology of hepatitis C virus infection. Lancet Infect Dis. 2005;5:558–67. - PubMed
    1. Bowen DG, Walker CM. Adaptive immune responses in acute and chronic hepatitis C virus infection. Nature. 2005;436:946–52. - PubMed
    1. Lechner F, Wong DK, Dunbar PR, et al. Analysis of successful immune responses in persons infected with hepatitis C virus. J Exp Med. 2000;191:1499–512. - PMC - PubMed
    1. Rehermann B, Chang KM, McHutchison JG, Kokka R, Houghton M, Chisari FV. Quantitative analysis of the peripheral blood cytotoxic T lymphocyte response in patients with chronic hepatitis C virus infection. J Clin Invest. 1996;98:1432–40. - PMC - PubMed
    1. Wedemeyer H, He XS, Nascimbeni M, et al. Impaired effector function of hepatitis C virus-specific CD8+ T cells in chronic hepatitis C virus infection. J Immunol. 2002;169:3447–58. - PubMed

Publication types

MeSH terms