Randomized Controlled Trial
. 2010 Nov 23;11(1):160.
doi: 10.1186/1465-9921-11-160.

Oral tolerance inhibits pulmonary eosinophilia in a cockroach allergen induced model of asthma: a randomized laboratory study

Affiliations
Randomized Controlled Trial

Oral tolerance inhibits pulmonary eosinophilia in a cockroach allergen induced model of asthma: a randomized laboratory study

Louis J Vaickus et al. Respir Res. .

Abstract

Background: Antigen desensitization through oral tolerance is becoming an increasingly attractive treatment option for allergic diseases. However, the mechanism(s) by which tolerization is achieved remain poorly defined. In this study we endeavored to induce oral tolerance to cockroach allergen (CRA: a complex mixture of insect components) in order to ameliorate asthma-like, allergic pulmonary inflammation.

Methods: We compared the pulmonary inflammation of mice which had received four CRA feedings prior to intratracheal allergen sensitization and challenge to mice fed PBS on the same time course. Respiratory parameters were assessed by whole body unrestrained plethysmography and mechanical ventilation with forced oscillation. Bronchoalveolar lavage fluid (BAL) and lung homogenate (LH) were assessed for cytokines and chemokines by ELISA. BAL inflammatory cells were also collected and examined by light microscopy.

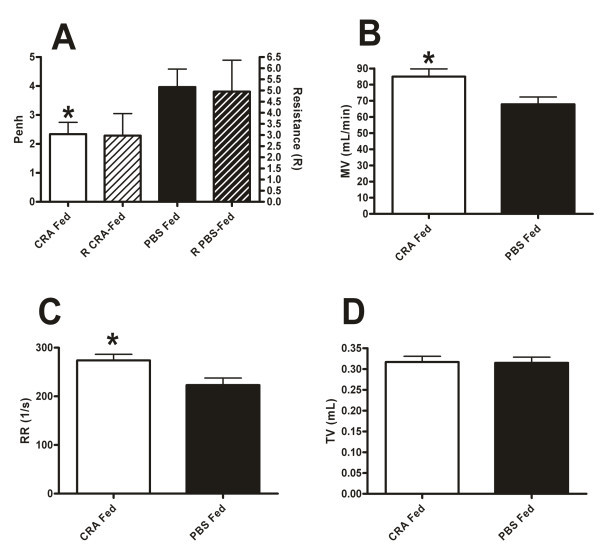
Results: CRA feeding prior to allergen sensitization and challenge led to a significant improvement in respiratory health. Airways hyperreactivity measured indirectly via enhanced pause (Penh) was meaningfully reduced in the CRA-fed mice compared to the PBS fed mice (2.3 ± 0.4 vs 3.9 ± 0.6; p = 0.03). Directly measured airways resistance confirmed this trend when comparing the CRA-fed to the PBS-fed animals (2.97 ± 0.98 vs 4.95 ± 1.41). This effect was not due to reduced traditional inflammatory cell chemotactic factors, Th2 or other cytokines and chemokines. The mechanism of improved respiratory health in the tolerized mice was due to significantly reduced eosinophil numbers in the bronchoalveolar lavage fluid (43300 ± 11445 vs 158786 ± 38908; p = 0.007) and eosinophil specific peroxidase activity in the lung homogenate (0.59 ± 0.13 vs 1.19 ± 0.19; p = 0.017). The decreased eosinophilia was likely the result of increased IL-10 in the lung homogenate of the tolerized mice (6320 ± 354 ng/mL vs 5190 ± 404 ng/mL, p = 0.02).

Conclusion: Our results show that oral tolerization to CRA can improve the respiratory health of experimental mice in a CRA-induced model of asthma-like pulmonary inflammation by reducing pulmonary eosinophilia.


Figures

Figure 1
Figure 1
Oral tolerance improves pulmonary respiratory parameters. Penh and resistance (A) were measured in CRA fed and PBS fed mice 4 hours after final CRA challenge. Penh was recorded at the plateau of airways hyperresponsiveness, 50 mg/mL for 5 minutes for Penh and 25 mg/mL for 10 minutes for resistance. Minute ventilation (B), respiratory rate (C) and tidal volume (D) were measured in CRA fed and PBS fed mice 4 hours after final CRA challenge. Data were recorded for 5 minutes in response to 50 mg/mL of methacholine. Each value is the mean ± SEM for n = 18 (Figure 1A Penh, 1B, 1C, 1D) and n = 8 (Figure 1A Resistance). * = p < 0.05 comparing CRA fed to PBS fed mice.
Figure 2
Figure 2
Oral tolerance improves inspiratory and expiratory parameters. Time of inspiration (A), time of expiration (B), peak inspiratory flow rate (C) and Peak expiratory flow rate (D) were measured in CRA fed and PBS fed mice 4 hours after final CRA challenge. Data were recorded for 5 minutes in response to 50 mg/mL of methacholine. Each value is the mean ± SEM for n = 18. * = p < 0.05 and ** = p < 0.01 comparing CRA fed to PBS fed mice.
Figure 3
Figure 3
Bronchoalveolar lavage (BAL) cellular constituents. BAL neutrophils (A), macrophages (B) and lymphocytes (C) in CRA fed and PBS fed mice harvested 4 hours after final CRA challenge. There was no change in the number of these cells in the BAL. Cell counts were expressed as the absolute number of cells collected in each sample. Each value is the mean ± SEM for n = 18.
Figure 4
Figure 4
Pulmonary and blood eosinophil recruitment. Bronchoalveolar lavage eosinophils (A) and lung homogenate eosinophil specific peroxidase (EPO) activity (B) were measured in CRA fed and PBS fed mice 4 hours after final CRA challenge. EPO was assessed in the lung homogenate following lavage to collect cells. Representative cytospin images from CRA fed (C) and PBS fed (D) mice stained with H+E at 100×. The circulating blood levels of eosinophils (E) were assessed in CRA fed and PBS fed mice 4 hours after final challenge using a Hemavet. Each value is the mean ± SEM for n = 18. ** = p < 0.01 comparing CRA fed to PBS fed mice.
Figure 5
Figure 5
Antigen specificity in oral tolerance. Penh in response to 50 mg/mL of methacholine (A), bronchoalveolar lavage eosinophils (B) and EPO activity (C) in OVA and PBS fed, CRA immunized and challenged mice. Each value is the mean ± SEM for n = 8. None of these parameters were statistically different from each other.
Figure 6
Figure 6
Lung histology. Representative lung histology sections from CRA-fed (A) and PBS-fed (B), CRA immunized and challenged mice. Sections are stained with H+E and PAS for mucus and magnified 10×. Quantitation of PAS staining area in CRA-fed and PBS-fed mice (C). Each value is the mean ± SEM for n = 18.
Figure 7
Figure 7
Lung homogenate IL-10. Oral tolerance increases pulmonary levels of IL-10. IL-10 was measured in the lung homogenate supernatant in CRA fed and PBS fed mice 4 hours after final CRA challenge. Cytokine concentration was assessed by sandwich ELISA with control lung homogenate supernatant background removed. Each value is the mean ± SEM for n = 18. * = p < 0.05 comparing CRA fed to PBS fed mice.

Similar articles

Cited by

References

    1. Mannino DM, Homa DM, Akinbami LJ, Ford ES, Redd SC. Chronic obstructive pulmonary disease surveillance--United States, 1971-2000. MMWR Surveill Summ. 2002;51(6):1–16. - PubMed
    1. National Heart LaBI. Morbidity and Mortality: 2007 Chart Book On Cardiovascular, Lung and Blood Diseases. 2007.
    1. Rosenstreich DL, Eggleston P, Kattan M, Baker D, Slavin RG, Gergen P, Mitchell H, McNiff-Mortimer K, Lynn H, Ownby D. et al.The role of cockroach allergy and exposure to cockroach allergen in causing morbidity among inner-city children with asthma. N Engl J Med. 1997;336(19):1356–1363. doi: 10.1056/NEJM199705083361904. - DOI - PubMed
    1. Campbell EM, Kunkel SL, Strieter RM, Lukacs NW. Temporal role of chemokines in a murine model of cockroach allergen-induced airway hyperreactivity and eosinophilia. J Immunol. 1998;161(12):7047–7053. - PubMed
    1. McKinley L, Kim J, Bolgos GL, Siddiqui J, Remick DG. Reproducibility of a novel model of murine asthma-like pulmonary inflammation. Clin Exp Immunol. 2004;136(2):224–231. doi: 10.1111/j.1365-2249.2004.02461.x. - DOI - PMC - PubMed

Publication types