Comparative Study
. 2010 Nov 18;68(4):668-81.
doi: 10.1016/j.neuron.2010.09.009.

NG2+ CNS glial progenitors remain committed to the oligodendrocyte lineage in postnatal life and following neurodegeneration

Affiliations
Comparative Study

NG2+ CNS glial progenitors remain committed to the oligodendrocyte lineage in postnatal life and following neurodegeneration

Shin H Kang et al. Neuron. .

Abstract

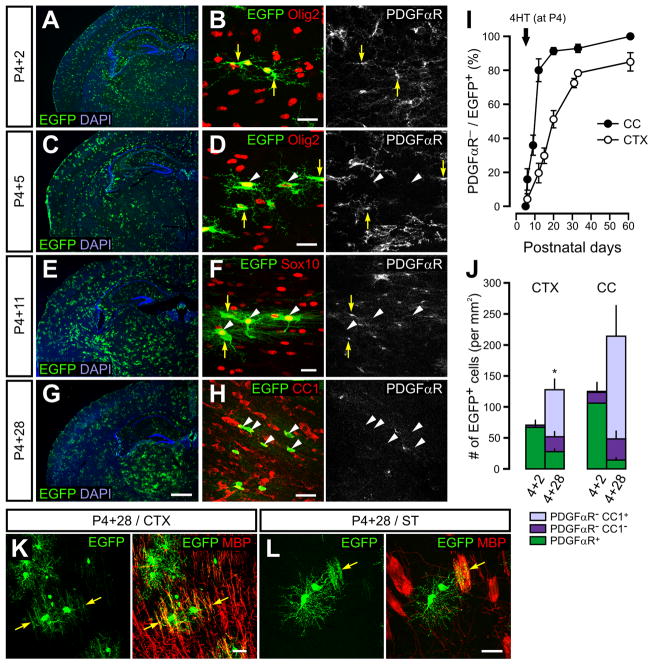
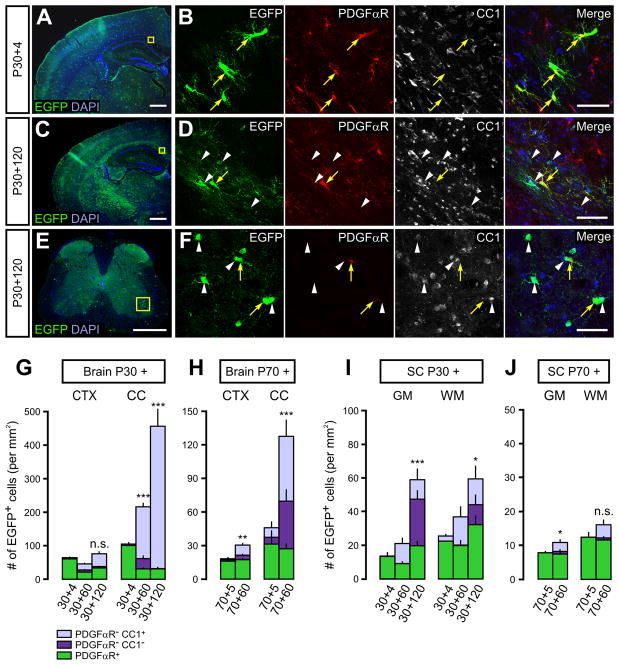
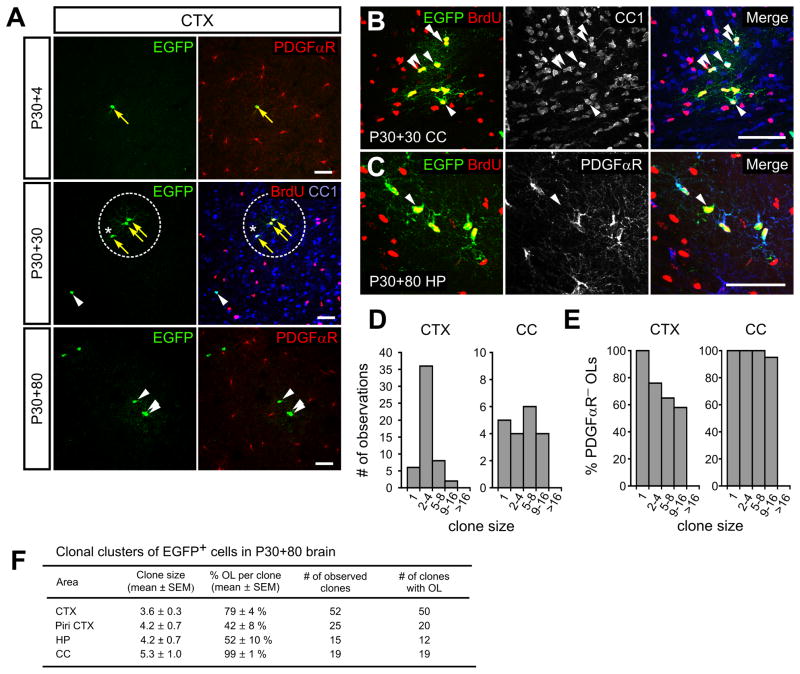
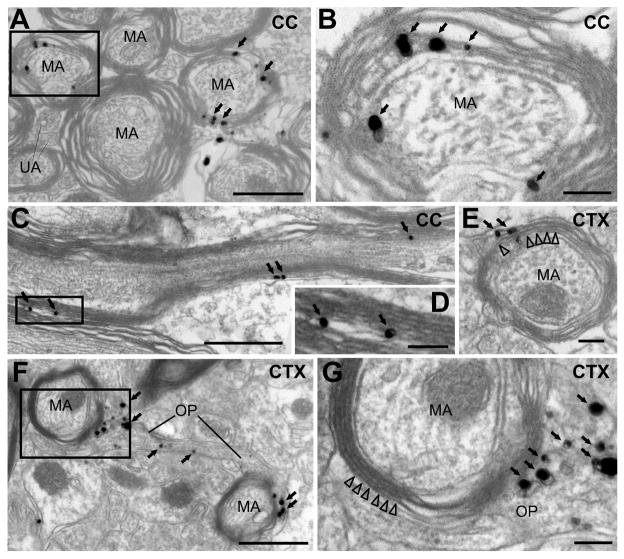
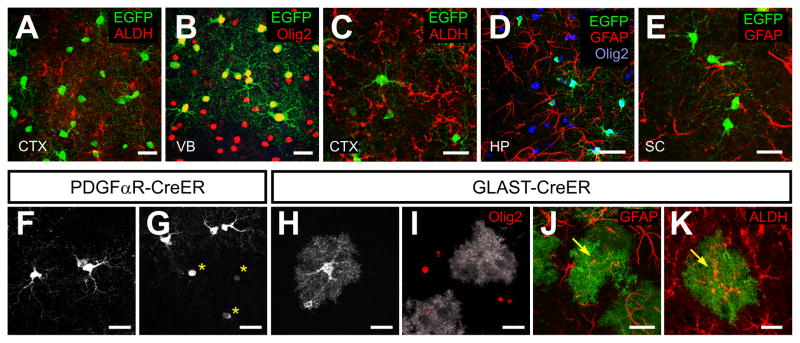
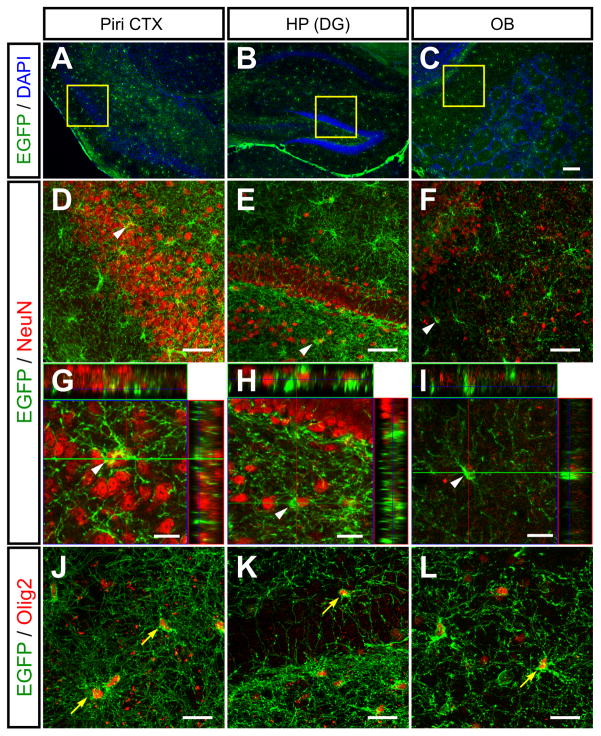
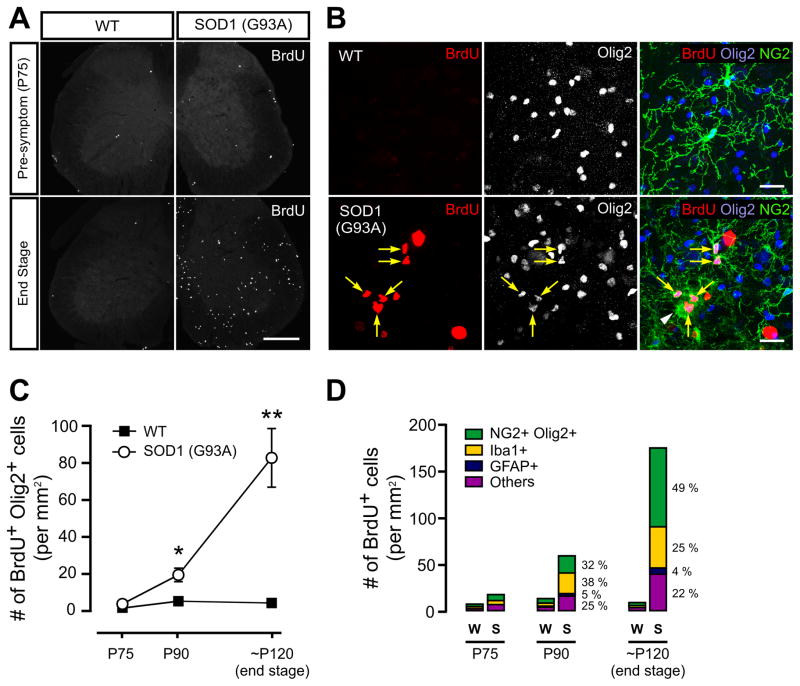
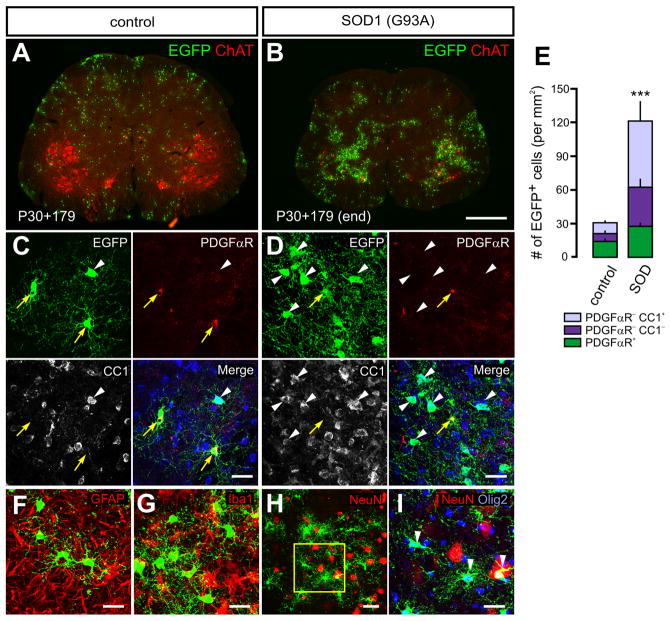
The mammalian CNS contains a ubiquitous population of glial progenitors known as NG2+ cells that have the ability to develop into oligodendrocytes and undergo dramatic changes in response to injury and demyelination. Although it has been reported that NG2+ cells are multipotent, their fate in health and disease remains controversial. Here, we generated PDGFαR-CreER transgenic mice and followed their fate in vivo in the developing and adult CNS. These studies revealed that NG2+ cells in the postnatal CNS generate myelinating oligodendrocytes, but not astrocytes or neurons. In regions of neurodegeneration in the spinal cord of ALS mice, NG2+ cells exhibited enhanced proliferation and accelerated differentiation into oligodendrocytes but remained committed to the oligodendrocyte lineage. These results indicate that NG2+ cells in the normal CNS are oligodendrocyte precursors with restricted lineage potential and that cell loss and gliosis are not sufficient to alter the lineage potential of these progenitors.


Figures

Figure 1
Figure 1. Oligodendrocytes develop rapidly from NG2+ cells during early postnatal life
(A, C, E, G) Images of EGFP+ cells in coronal brain sections of PDGFαR-CreER;Z/EG mice taken 2 (A), 5 (C), 11 (E) or 28 days (G) after 4HT administration at P4. Nuclei are stained by DAPI. (B, D, F, H) Confocal images showing EGFP+ cells that were immunoreactive to PDGFαR, Olig2, Sox10, or CC1 in the corpus callosum. Yellow arrows indicate PDGFαR+ cells, and white arrowheads indicate PDGFαROlig2+ (D), PDGFαRSox10+ (F), or PDGFαRCC1+ cells (H). Scale bars = 500μm (A, C, E, G) or 20μm (B, D, F, H). (I) Changes in the percentage of PDGFαREGFP+ cells in the corpus callosum (CC, filled circles) and cortex (CTX, open circles) over time after 4HT administration at P4. (J) Histogram showing the number of EGFP+ NG2+ cells (PDGFαR+), pre-myelinating OLs (PDGFαRCC1) and OLs (CC1+) in the cortex (CTX) and corpus callosum (CC) of PDGFαR-CreER;Z/EG mice 2 and 28 days after 4HT administration at P4. Error bars display mean + SEM. (K and L) Confocal images showing EGFP and MBP immunoreactivity in the cortex (CTX) (K) and striatum (ST) (L) of PDGFαR-CreER;Z/EG mice at P4+28. Yellow arrows indicate co-localization between EGFP and MBP. Scale bars = 20μm.
Figure 2
Figure 2. NG2+ cells continue to generate OLs in the adult mouse brain and spinal cord
(A, C and E) Images of EGFP+ cells and DAPI staining in coronal brain sections (A and C) and lumbar spinal cord (E) from PDGFαR-CreER;Z/EG mice taken 4 (A) or 120 days (C, E) after 4HT administration at P30. Yellow boxes highlight regions expanded in B, D and F. Scale bar = 500 μm. (B, D and F) Confocal images showing EGFP, PDGFαR and CC1 immunoreactivity for the regions highlighted in A, C and E. Yellow arrows indicate EGFP+PDGFαR+ cells and white arrowheads indicate EGFP+CC1+ OLs. Scale bars = 50μm. (G–J) Histograms showing the number of EGFP+ NG2+ cells (PDGFαR+), pre-myelinating OLs (PDGFαRCC1) and mature OLs (PDGFαRCC1+) in the cortex (CTX) and corpus callosum (CC) of the brain (G, H), and in the gray (GM) and white matter (WM) of the spinal cord (I, J) in PDGFαR-CreER;Z/EG mice at different times after 4HT administration at P30 (G, I) or P70 (H, J). Error bars display mean + SEM. The number of EGFP+ cells increased significantly in the corpus callosum (p = 1.3×10 −6, by one-way ANOVA) and spinal cord (p = 2.2×10 −9 for GM, and p = 0.011 for WM by one-way ANOVA) from 4 to 60 and 120 days after 4HT administration at P30. EGFP+ cell number also increased in the cortex, corpus callosum and spinal cord gray matter from 5 to 60 days after 4HT administration at P70. (* p < 0.05. ** p < 0.005, *** p < 1.0×10 −4, n.s. = not significant, when evaluated by the Student’s t-test).
Figure 3
Figure 3. NG2+ cells in the mature brain are not postmitotic or terminally differentiated
(A) Images of EGFP+ cells exhibiting PDGFαR, BrdU and CC1 immunoreactivity in the cortex of PDGFαR-CreER;Z/EG mice after exposure to a low dose of 4HT. Mice were examined at P30+4 (top), P30+30 (middle) and P30+80 (bottom). A single clone is highlighted by a dashed circle (middle). Yellow arrows highlight EGFP+ PDGFαR+ cells (top) and EGFP+BrdU+ cells (middle), and white arrowheads highlight an EGFP+BrdU CC1+ cell (middle) and EGFP+ PDGFαR cells (bottom). Asterisks indicate an EGFP+BrdU+CC1+ OLs (middle). Scale bars = 50μm. (B, C) Confocal images of EGFP+BrdU+ cell clusters representing individual clones located in the corpus callosum (B) or in hippocampus (C) from PDGFαR-CreER;Z/EG mice at P30+30 or at P30+80, respectively. White arrowheads indicate either EGFP+CC1+ (B) or EGFP+PDGFαR (C) OLs. Scale bar = 50μm. (D) Histograms showing the frequency of EGFP+ cell clones of different sizes in the cortex (CTX) and corpus callosum (CC) at P30+80 in PDGFαR-CreER;Z/EG mice. (E) Histograms showing the percentage of PDGFαR OLs in EGFP+ cell clones of different sizes in the cortex (CTX) and corpus callosum (CC) for the clones shown in (D). (F) Table showing the average size of EGFP+ cell clones in the dorso-lateral cortex (CTX), piriform cortex (Piri CTX), hippocampus (HP) and corpus callosum (CC), the percentage of PDGFαR cells in each clone, the number of clones, and the number of clones that had at least one PDGFαR OL (EGFP+PDGFαR cell).
Figure 4
Figure 4. Oligodendrocytes generated from NG2+ cells form myelin
Electron micrographs of the corpus callosum (A – C) and cortex (E – G) from PDGFαR-CreER;ROSA26-mGFP mice at P30+150 showing silver-enhanced immunogold labeling of EGFP. Arrows highlight silver particles located within myelin sheaths, and arrowheads in E and G indicate myelin. Black boxes in A, C and F are shown at higher magnification in B, D and G, respectively. MA, myelinated axon; OP, OL process; CC, corpus callosum; CTX, cerebral cortex. Scale bars = 100 nm (A, C, F) or 500 nm (B, D, E, G).
Figure 5
Figure 5. NG2+ cells in the postnatal brain do not generate astrocytes
(A – E) Confocal images showing immunoreactivity to EGFP, ALDH, Olig2 and GFAP in the dorsal cortex (CTX; A, C), ventral forebrain (VB; B), hippocampus (HP; D), and spinal cord (SC; E) in PDGFαR-CreER;Z/EG mice at P4+96 (A and B) or P30+120 (C – G). (F – K) Comparison of the morphologies of EGFP+ cells from PDGFαR-CreER;Z/EG mice at P30+120 (F, G), GLAST-CreER;Z/EG at P11+10 (H) or GLAST-CreER;ROSA26-mGFP mice at P15+21(I – K). Confocal images of EGFP+ cells from cortex (F – I), hippocampus (J) or ventral forebrain (K). Yellow asterisks highlight mature OLs, in which cytosolic EGFP is visible only within the soma (G). Yellow arrows in J and K show EGFP+ astrocytes that were GFAP+ or ALDH+. Scale bars = 20 μm.
Figure 6
Figure 6. NG2+ cells do not give rise to neurons in the postnatal CNS
(A – C) Images of EGFP+ cells the piriform cortex (Piri CTX; A) dentate gyrus (DG; B) and olfactory bulb (OB; C) in PDGFαR-CreER;ROSA26-mGFP mice at P30+150. Nuclei are labeled with DAPI. (D – F) Confocal images showing EGFP and NeuN immunoreactivity in the regions highlighted by the yellow boxes in A – C. Orthogonal views are shown in (G – H) to indicate the spatial relationship between the NeuN+ neurons and EGFP+ cells indicated by the white arrowheads. (J – L) Confocal images of EGFP+ cells exhibiting Olig2+ immunoreactivity in these brain regions. Yellow arrows highlight several EGFP+Olig2+ cells. Scale bars = 100μm (A – C), 50μm (D – F) and 20 μm (G – I).
Figure 7
Figure 7. Enhanced proliferation of NG2+ cells in the spinal cord of ALS mice
(A) Sections of lumbar spinal cord from wild type (WT) and SOD1 mutant (G93A) mice showing BrdU+ cells at the presymptomatic (upper panels) and end stages (lower panels). Scale bars = 500 μm. (B) Confocal images showing BrdU, Olig2 and NG2 immunoreactivity in the lumbar spinal cord gray matter from WT and SOD1 (G93A) mice at end stage. Yellow arrows indicate BrdU+NG2+ cells, and the white arrowhead represents an NG2-expressing macrophage/microglia-like cell (Iba1+Olig2). Scale bars = 20μm. (C) Plot of the number of BrdU+ Olig2+ cells in the lumbar spinal cord of wild type and SOD1 (G93A) mice during disease progression (from P75 to end stage). The number of BrdU+ Olig2+ cells was significantly greater at P90 and end stage in SOD1 (G93A) mice than in age matched wild type littermates. * p <0.05. ** p < 0.0001. Statistical comparisons were made by Student’s t-test. (D) Histograms showing the number of NG2+ cells (NG2+Olig2+), microglial cells (Iba1+), astrocytes (GFAP+) and other (undefined) cells that were BrdU+ in the lumbar spinal cord of wildtype and SOD1 (G93A) mice at different ages.
Figure 8
Figure 8. Enhanced differentiation of NG2+ cells into oligodendrocytes in ALS mice
(A and B) Images of EGFP and choline acetyl transferase (ChAT) immunoreactivity in sections of lumbar spinal cord from aged-matched, littermate PDGFαR-CreER;Z/EG (A) and PDGFαR-CreER;Z/EG;SOD1(G93A) (B) mice at P30+179. Scale bars = 500μm. (C and D) Confocal images of EGFP, PDGFαR and CC1 immunoreactivity in the lumbar spinal cord of PDGFαR-CreER;Z/EG (C) and PDGFαR-CreER;Z/EG;SOD1(G93A) (D) mice at P60+60. Yellow arrows and white arrowheads indicate EGFP+PDGFαR+ cells and EGFP+CC1+ cells, respectively. Scale bars = 20μm. (E) Histograms of the number of EGFP+NG2+ cells (PDGFαR+), pre-myelinating OLs (PDGFαRCC1) and OLs (PDGFαRCC1+) in the lumbar spinal cord of PDGFαR-CreER;Z/EG (control) and PDGFαR-CreER;Z/EG;SOD1(G93A) mice (SOD) that were administered 4HT at P60 and examined at end stage (~P120). *** p < 5.5×10⁻⁵ for comparisons of the number of EGFP+ cells between WT and SOD1(G93A) PDGFαR-CreER;Z/EG mice. (F – I) Images of EGFP+ cells in PDGFαR-CreER;Z/EG;SOD1(G93A) mice at P60+60 (end stage) showing that these cells were not GFAP+ astrocytes (F), Iba1+ microglia (G) or NeuN+ neurons (H and I). (I) Higher magnification image of boxed area in H showing that all of EGFP+ cells were Olig2+. Scale bars = 20μm.

References

    1. Aguirre A, Gallo V. Postnatal neurogenesis and gliogenesis in the olfactory bulb from NG2-expressing progenitors of the subventricular zone. J Neurosci. 2004;24:10530–10541. - PMC - PubMed
    1. Aguirre A, Gallo V. Reduced EGFR signaling in progenitor cells of the adult subventricular zone attenuates oligodendrogenesis after demyelination. Neuron Glia Biol. 2007;3:209–220. - PMC - PubMed
    1. Aguirre AA, Chittajallu R, Belachew S, Gallo V. NG2-expressing cells in the subventricular zone are type C-like cells and contribute to interneuron generation in the postnatal hippocampus. J Cell Biol. 2004;165:575–589. - PMC - PubMed
    1. Badea TC, Wang Y, Nathans J. A noninvasive genetic/pharmacologic strategy for visualizing cell morphology and clonal relationships in the mouse. J Neurosci. 2003;23:2314–2322. - PMC - PubMed
    1. Belachew S, Chittajallu R, Aguirre AA, Yuan X, Kirby M, Anderson S, Gallo V. Postnatal NG2 proteoglycan-expressing progenitor cells are intrinsically multipotent and generate functional neurons. J Cell Biol. 2003;161:169–186. - PMC - PubMed

Publication types

MeSH terms

Substances