Comparative Study
. 2010 Nov 18;68(4):695-709.
doi: 10.1016/j.neuron.2010.09.027.

Genetic mosaic dissection of Lis1 and Ndel1 in neuronal migration

Affiliations
Comparative Study

Genetic mosaic dissection of Lis1 and Ndel1 in neuronal migration

Simon Hippenmeyer et al. Neuron. .

Abstract

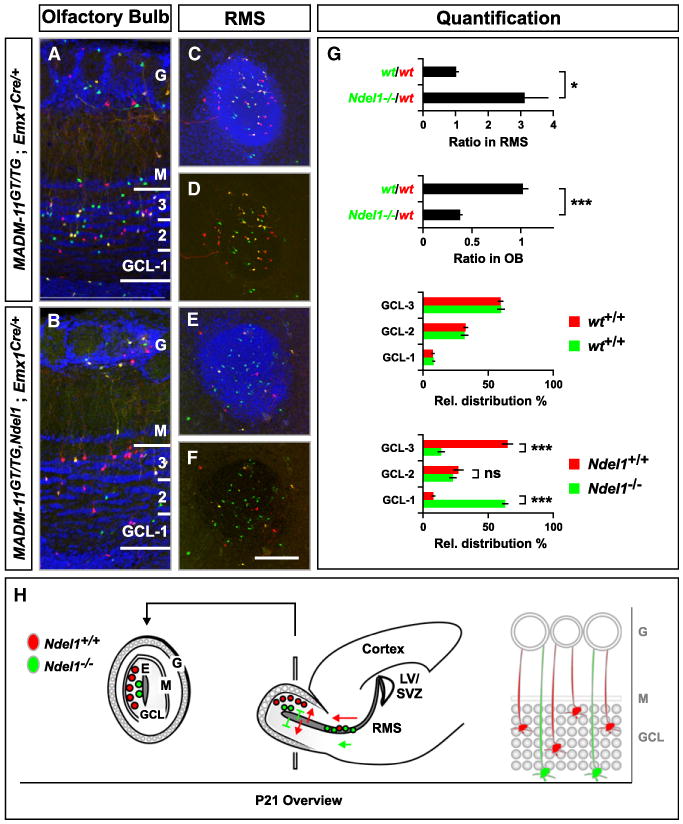
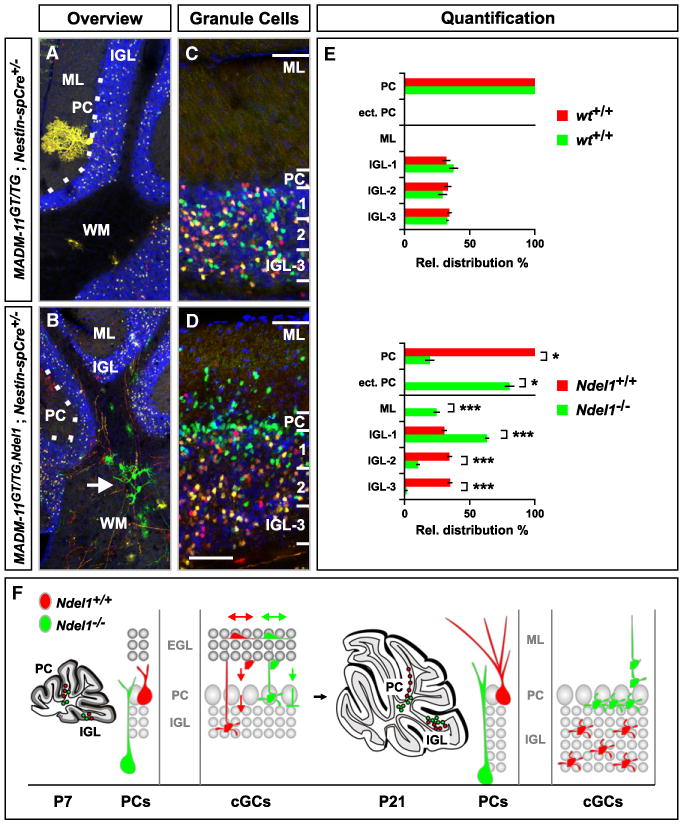
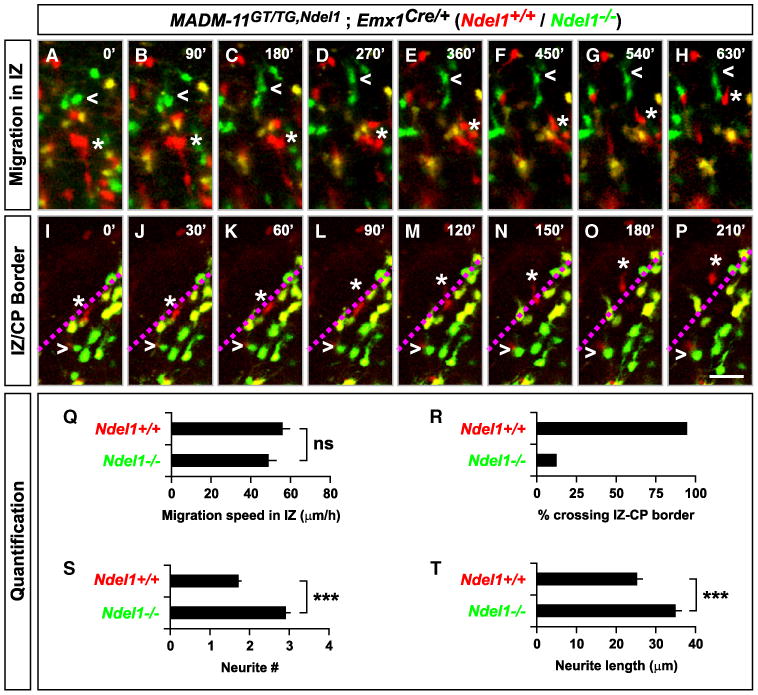
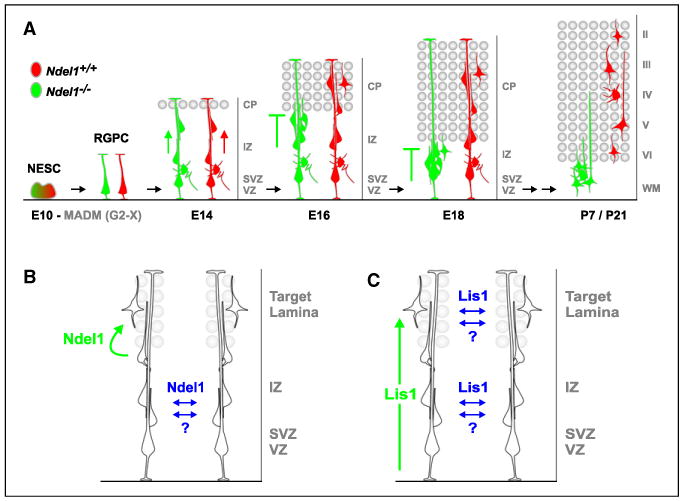
Coordinated migration of newly born neurons to their prospective target laminae is a prerequisite for neural circuit assembly in the developing brain. The evolutionarily conserved LIS1/NDEL1 complex is essential for neuronal migration in the mammalian cerebral cortex. The cytoplasmic nature of LIS1 and NDEL1 proteins suggest that they regulate neuronal migration cell autonomously. Here, we extend mosaic analysis with double markers (MADM) to mouse chromosome 11 where Lis1, Ndel1, and 14-3-3ɛ (encoding a LIS1/NDEL1 signaling partner) are located. Analyses of sparse and uniquely labeled mutant cells in mosaic animals reveal distinct cell-autonomous functions for these three genes. Lis1 regulates neuronal migration efficiency in a dose-dependent manner, while Ndel1 is essential for a specific, previously uncharacterized, late step of neuronal migration: entry into the target lamina. Comparisons with previous genetic perturbations of Lis1 and Ndel1 also suggest a surprising degree of cell-nonautonomous function for these proteins in regulating neuronal migration.


Figures

Figure 1
Figure 1. Extension of MADM to Mouse Chromosome 11
(A) The Hipp11 genomic locus in cytoband A1 (∼3 cM) between Eif4enif1 and Drg1 genes. (B) Targeting of Hipp11 with GT and TG cassettes to generate MADM-11GT and MADM-11TG. Top panel shows the organization of the Hipp11 genomic locus. Grey boxes indicate exons 1 and 19 of the flanking gene Eif4enif1, and exons 1 and 9 of Drg1. Middle and bottom panels show the Hipp11 genomic locus with integrated GT and TG cassettes. LoxP (black triangles), FRT (rectangle), and the direction of transcription (green arrow) are indicated. Details about recombination products and reconstituted marker genes upon CRE/FLPe-mediated interchromosomal recombination can be found in Figures S1–S3. (C–H) GFP (green in C–E and H; white in F) and tdT (red in C–E and H; white in G) expression in cortex and hippocampus in P21 MADM-11 mice. (C and H) Sparse MADM labeling of cortical pyramidal cells in MADM-11GT/TG;Rosa26FLPe/+ (C) or MADM-11GT/TG;Nestin-spCre+/− (H). (D) Overview of labeling pattern in MADM-11GT/TG;Emx1Cre/+. (E–G) Higher magnification of D (boxed area) illustrating CA3 pyramidal cells and mossy fiber projections from dentate gyrus granule cells. (I) Schematic depicts TM-mediated MADM-clone induction at E10 in MADM-11GT/TG;Nestin-CreER+/− in symmetrically dividing neuroepithelial stem cell (NESC). A G2-X event (see Figure S1 for a description of the MADM principle) results in two columns of green and red labeled neurons migrating along the processes of radial glia progenitor cells (RGPCs). (J–M) A G2-X MADM clone in the cortex with neurons expressing GFP (green) and tdT (red), and migrating along RGPCs at E16 (J). Inset in (J) marks area shown in (K)–(M) and depicts red and green apical endfeet of MADM-labeled radial glia with migrating neurons in the VZ. Nuclei (D, J, and K) were labeled using DAPI (blue). CP, cortical plate; IZ, intermediate zone; SVZ, subventricular zone; VZ, ventricular zone; TM, Tamoxifen. Scale bar, 100 μm (C); 1 mm (D); 30 μm (E–G and K–M); 70 μm (H and J). See also Figures S1 and S2.
Figure 2
Figure 2. MADM Analysis of Lis1, Ndel1, and 14-3-3ε in Somatosensory Cortex
(A) Genomic location of MADM-11 and Lis1, Ndel1 and 14-3-3ε genes on Chr. 11. Physical and genetic distances to the centromere are indicated. (B–E) MADM-labeled cells in P21 somatosensory barrel cortex in control-MADM (B; MADM-11GT/TG;Emx1Cre/+), Lis1-MADM (C; MADM-11GT/TG,Lis1;Emx1Cre/+), Ndel1-MADM (D; MADM-11GT/TG,Ndel1;Emx1Cre/+) and 14-3-3ε-MADM (E; MADM-11GT/TG, 14-3-3ε;Emx1Cre/+). In control-MADM (B), GFP+ (green), tdT+ (red), and GFP+/tdT+ (yellow) cells are all WT. In Lis1-, Ndel1-, and 14-3-3ε MADM (C–E), homozygous mutants are GFP+ (green), heterozygous cells are GFP+/tdT+ (yellow) or unlabeled (vast majority), and homozygous WT cells are tdT+ (red). Nuclei were stained using DAPI (blue). White star in (B) marks tdT+ cortical astrocytes. Arrows in (C) indicate sparse green Lis1−/− mutant neurons. Arrows in (D) point to Ndel1−/− astrocytes. Cortical layers are numbered in roman digits. WM: white matter. Scale bar, 150 μm. (F) Quantification of green/red ratio of neurons (upper panel) and cortical astrocytes (lower panel) corresponding to respective genotypes in (B–E). No Lis1−/− mutant astrocytes were observed in any sample analyzed. (G–J) Quantification of the relative distribution (%) of mutant green, heterozygote yellow and WT red neurons (upper panels) and astrocytes (lower panels) for genotypes corresponding to (B)–(E). Values represent mean ± SEM ns: nonsignificant, *p < 0.05, **p < 0.01, and ***p < 0.001. See also Figures S2–S4.
Figure 3
Figure 3. MADM Analysis of Lis1, Ndel1, and 14-3-3ε in the Hippocampus
(A–D) MADM-labeled cells in P21 CA1 hippocampus in control- (A), Lis1- (B), Ndel1- (C), and 14-3-3ε- (D) MADM. Genotypes and fluorescent labeling are as depicted in Figure 2. The CA1 layer is indicated in (A) and double arrow indicates the distance of the CA1 field from the base of the hippocampus. White arrows in (B) mark ectopic CA1 cell masses. Green stars mark ectopic cells in (C) and (D). Scale bar, 50 μm. (E) Relative distribution (%) of pyramidal cells within the CA1 layer (CA1) or at ectopic locations (ect. CA1) in control- (top), Ndel1- (middle), and 14-3-3ε- (bottom) MADM. (F) Distance (μm) of CA1 pyramidal cell soma from the base of the hippocampus in CA1 in control-, Lis1-, Ndel1-, and 14-3-3ε-MADM. Values represent mean ± SEM ns: nonsignificant; **p < 0.01 and ***p < 0.001. (G) Schematic summary of migration of WT (red) and Ndel1−/− (green) MADM-labeled hippocampal CA1 and CA3 pyramidal neurons (CA) and dGCs. Red WT CA1 and CA3 pyramidal neurons migrate radially and exit the ventricular zone to form the pyramidal cell layers (gray circles). Green Ndel1−/− CA1 and CA3 pyramidal neurons remain at the base of the CA1/CA3 subfields. Red WT dGCs migrate radially to different sublayers of the dentate gyrus granule layer (gray circles). Green Ndel1−/− dGCs accumulate at the hilus and at the base of the dentate granule cell layer but do not properly invade the target layer. See also Figure S5.
Figure 4
Figure 4. Ndel1 Function is Essential for Migration of Olfactory Interneurons
(A and B) Distribution of olfactory bulb interneurons (oINs) across the granule cell layer (GCL) in the P21 OB. Genotypes are indicated, Ndel1−/− cells labeled with GFP (green) and WT cells with tdT (red). Note the reduction of green Ndel1−/− cells in (B). (C–F) Distribution of migrating oINs in cross sections of the RMS. Nuclei were stained using DAPI to outline the cytoarchitecture of the OB (A and B) and RMS (C and E). G, glomerular layer; M, mitral cell layer. Scale bar, 100 μm (A and B); 150 μm (C–F). (G) Quantification of the green/red ratio in the RMS and the OB (upper panels) and the relative distribution (%) of oINs across three equal sectors in the GCL (lower panels). Values represent mean ± SEM ns: nonsignificant; *p < 0.05 and ***p < 0.001. (H) Schematic summary of migration of WT (red) and Ndel1−/− (green) MADM-labeled oINs. Red WT oINs originate from the subventricular zone of the lateral ventricle (SVZ/LV), migrate along the RMS to the OB, where oINs exit the RMS to migrate centrifugally to occupy different layers of the GCL. Green Ndel1−/− oINs accumulate along the RMS as indicated by the higher number of green circles in the RMS, and accumulate significantly closer to the ependymal layer (E) (extension of RMS) within the OB than red WT cells, suggesting a defect in migration in the target lamina (gray circles in the high magnification scheme on the right). G, glomerular layer; M, mitral cell layer; GCL, granule cell layer. See also Figure S6.
Figure 5
Figure 5. Ndel1 Is Required for Migration of Cerebellum Purkinje and Granule Cells
(A–D) Distribution of Purkinje cells and cGCs in P21 cerebellum. Genotypes are indicated, Ndel1−/− cells labeled with GFP (green) and WT cells with tdT (red). (A and B) Central part of the cerebellum with the white matter (WM), Purkinje cell (PC) layer (white dotted line), internal granule cell layer (IGL) and molecular layer (ML) labeled. Ndel1−/− Purkinje cells are mostly localized in the white matter (B, white arrow). See Figure 8F for high-resolution image of Ndel1−/− Purkinje cell. (C and D) Distribution of cGCs in control- (C) and Ndel1-MADM (D). Scale bar, 150 μm (A and B); 60 μm (C and D). (E) Quantification of Purkinje cell distribution (%) in the PC layer or in ectopic locations (ect. PC), and cGCs across the molecular (ML) and internal granule layer (IGL), in control- (upper panel) and Ndel1-MADM (lower panel). The IGL was divided into three equal sectors for quantification of the relative distribution of cGCs. Values represent mean ± SEM ns: nonsignificant; *p < 0.05 and ***p < 0.001. (F) Schematic summary of migration of WT (red) and Ndel1−/− (green) cerebellar Purkinje cells and cGCs. cGCs are born at the most superficial sublayer of the external granule layer (EGL) during the first 3 postnatal weeks (left panel). Nascent WT cGCs migrate inward across the ML, pass the PC layer, and settle throughout the IGL (small gray circles representing the final positions of cGCs). Most Ndel1−/− cGCs also migrate across the ML, but a fraction fails to pass the PC layer. Ndel1−/− cGCs that pass the PC layer accumulate at the most superficial sublayer of the IGL. See also Figure S6.
Figure 6
Figure 6. Ndel1 Cell Autonomously Regulates Cortical Neuron Migration into the Cortical Plate
(A–H) Time course analysis of migration pattern of MADM-labeled cortical projection neurons using in control- (A, C, E, and G) and Ndel1-MADM (B, D, F, and H) at E12 (A and B), E14 (C and D), E16 (E and F) and P1 (G and H). Genotypes are indicated, Ndel1−/− cells labeled with GFP (green) and WT cells with tdT (red). (I–P) Clonal analysis in MADM-11GT/TG,Ndel1;Nestin-CreER+/− embryonic cortex. (I–L) TM was applied at E10 (TM/E10) and sample analyzed at E16 (A/E16). G2-X clone is illustrated with Ndel1+/+ cells (red in I and L; white in J) and Ndel1−/− cells (green in I and L; white in K). White star marks the border of the cortical plate where Ndel1−/− cells accumulate. (M–P) Time course of clonal analysis in MADM-11GT/TG,Ndel1;Nestin-CreER+/− with TM applied at E8 (M) or E10 (N–P) and samples analyzed at E14 (M and N), E16 (O) and E18 (P). Scale bar, 30 μm (A and B); 60 μm (C and D); 100 μm (E, F, I–L, O, and P); 150 μm (G and H); 50 μm (M and N). (Q–U) Quantification of ratio of green/red cells (Q) and relative distribution (%) of red and green cells in the VZ/SVZ, IZ, and CP (R–U). Genotypes (top) indicate control-MADM (left column) and Ndel1-MADM (right column) using Emx1Cre/+ at E14 (R), E16 (S), and P1 (T) or Nestin-CreER+/− (TM/E10; A/E16) (U). Values represent mean ± SEM ns, nonsignificant; *p < 0.05 and ***p < 0.001.
Figure 7
Figure 7. Live Imaging of MADM-Labeled Ndel1−/− Cortical Projection Neurons
(A–P) Time-lapse images of migrating cortical projection neurons in the IZ (A–H) and at the border to the CP (I–P) in organotypic cortical slices derived from Ndel1-MADM (MADM-11GT/TG,Ndel1;Emx1Cre/+) mice at E14.5. Open arrowheads mark Ndel1−/− cells (GFP, green) and stars mark Ndel1+/+ control cells (tdT, red). The border between the IZ and CP is indicated as dotted line in magenta (I–P). Frames are every 90′ (A–H) and 30′ (I–P). Scale bar, 50 μm (A–H); 40 μm (I–P). (Q–T) Quantification of (Q) migration speed in IZ (n = 33 each for Ndel1+/+ and Ndel1−/− cells each); (R) fraction of labeled cells crossing the IZ-CP border (n = 19, 24 for Ndel1+/+ and Ndel1−/− cells, respectively); (S) number of neurite branches (n = 58 each for Ndel1+/+ and Ndel1−/− cells); (T) neurite length of migrating cells in IZ (n = 51, 65 for Ndel1+/+ and Ndel1−/− cells, respectively). Values in (Q), (S), and (T) represent mean ± SEM; ns, nonsignificant; ***p < 0.001. See also Figure S7 and Movies S1 and S2.
Figure 8
Figure 8. Dendrite Morphogenesis and Axonal Projections of Ndel1−/− Neurons
(A–F) Morphology and dendrite pattern of pyramidal cells in the cortex (A and B), in the CA3 layer of the hippocampus (C and D), and in Purkinje cells of the cerebellum (E and F) in control- (A, C, and E) and Ndel1-MADM (B, D, and F). Genotypes of green and red cells are shown below each panel. All images are from P21 animals with the following genotypes: MADM-11GT/TG;Emx1Cre/+ (A and C); MADM-11GT/TG,Ndel1;Emx1Cre/+ (B and D); MADM-11GT/TG;Nestin-spCre+/− (E); MADM-11GT/TG,Ndel1;Nestin-spCre+/− (F). Arrows in (A and B) point to basal segments of pyramidal cells in the cortex; white stars (A, B, and D) mark apical dendrites in pyramidal cells in the cortex (A and B) and CA3 hippocampus (D). ML, molecular layer; PC, Purkinje cell layer; IGL, internal granule layer. (G–R) Axonal projections in control- and Ndel1-MADM using Emx1Cre/+. (G–J) Corticothalamic projections in thalamus at P21 (G and H) and P1 (I and J). Inset in (G and H) are higher magnification images highlighting axonal varicosities in Ndel1−/− corticothalamic projections. Inset in (J) highlights red Ndel1+/+, yellow Ndel1+/−, and green Ndel1−/− nascent growing axons in P1 thalamus. (K–P) Time course of axonal projections in the internal capsule in control- (K, M and O) and Ndel1-MADM (L, N and P) at P1 (K and L), P7 (M and N) and P21 (O and P). Note the progressive increase in number and size of axonal varicosities as marked by white arrows (N and P) in green Ndel1−/− mutant subcortical projections. (Q and R) Hippocampal efferents in the fornix in control- (Q) and Ndel1-MADM (R) at P21. White arrow in (R) marks accumulation of varicosities from green Ndel1−/− axons. Scale bar, 30 μm (A–D); 50 μm (E and F); 230 μm (G, H, and M–P); 200 μm (K and L); 110 μm (I, J, Q, and R). See also Figures S8 and S9.
Figure 9
Figure 9. Cell-Autonomous and Nonautonomous Functions of LIS1 and NDEL1 in Neuronal Migration
(A) Schematic summary of migration of WT (red) and Ndel1−/− (green) MADM-labeled cortical projection neurons illustrating the cell-autonomous function of NDEL1 to control invasion into the cortical plate, their target lamina. WT neurons exit the VZ, migrate across the IZ (red arrow), and into the CP along the RGPC fiber, settling within distinct layers of the cortex according to their birth date. Ndel1−/− neurons migrate out of the VZ and across the IZ (green arrow), but fail to migrate into the CP (−|), representing the target lamina (gray circles) for cortical projection neurons. Ndel1−/− neurons accumulate below the expanding CP during embryogenesis and eventually remain ectopically located in the white matter (WM) at postnatal stages. (B and C) Models of cell-autonomous (green) and nonautonomous (blue) in vivo functions of NDEL1 (B) and LIS1 (C) in the developing brain. NDEL1 cell autonomously controls invasion and/or migration within developing target laminae. LIS1 cell autonomously regulates the efficiency of neuronal migration in a dose-dependent manner. In addition, extensive interactions among migrating neurons, either mediated by specific cell-nonautonomous effects of LIS1/NDEL1 or through a general community effect, promote migration of Ndel1−/− cells before reaching the target laminae and Lis1−/− cells along the entire path under sparse knockout conditions.

References

    1. Altman J, Bayer SA. Prolonged sojourn of developing pyramidal cells in the intermediate zone of the hippocampus and their settling in the stratum pyramidale. J Comp Neurol. 1990;301:343–364. - PubMed
    1. Altman J, Bayer SA. The Development of the Cerebellar System in Relation to Its Evolution, Structure, and Functions. Boca Raton, FL: CRC Press; 1997.
    1. Angevine JB, Jr, Sidman RL. Autoradiographic study of cell migration during histogenesis of cerebral cortex in the mouse. Nature. 1961;192:766–768. - PubMed
    1. Cahana A, Escamez T, Nowakowski RS, Hayes NL, Giacobini M, von Holst A, Shmueli O, Sapir T, McConnell SK, Wurst W, et al. Targeted mutagenesis of Lis1 disrupts cortical development and LIS1 homodimerization. Proc Natl Acad Sci USA. 2001;98:6429–6434. - PMC - PubMed
    1. Chae T, Kwon YT, Bronson R, Dikkes P, Li E, Tsai LH. Mice lacking p35, a neuronal specific activator of Cdk5, display cortical lamination defects, seizures, and adult lethality. Neuron. 1997;18:29–42. - PubMed

Publication types

MeSH terms

Substances