. 2010 Nov 24;33(5):736-51.
doi: 10.1016/j.immuni.2010.10.017.

Regulated expression of nuclear receptor RORγt confers distinct functional fates to NK cell receptor-expressing RORγt(+) innate lymphocytes

Affiliations

Regulated expression of nuclear receptor RORγt confers distinct functional fates to NK cell receptor-expressing RORγt(+) innate lymphocytes

Cedric Vonarbourg et al. Immunity. .

Abstract

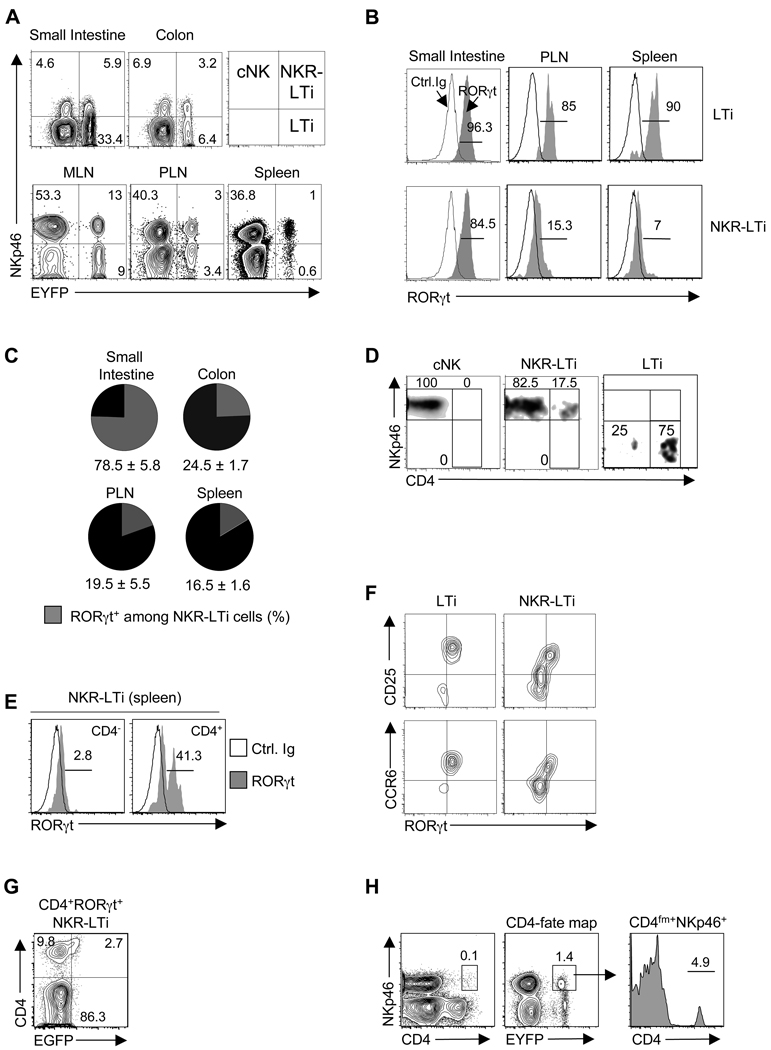
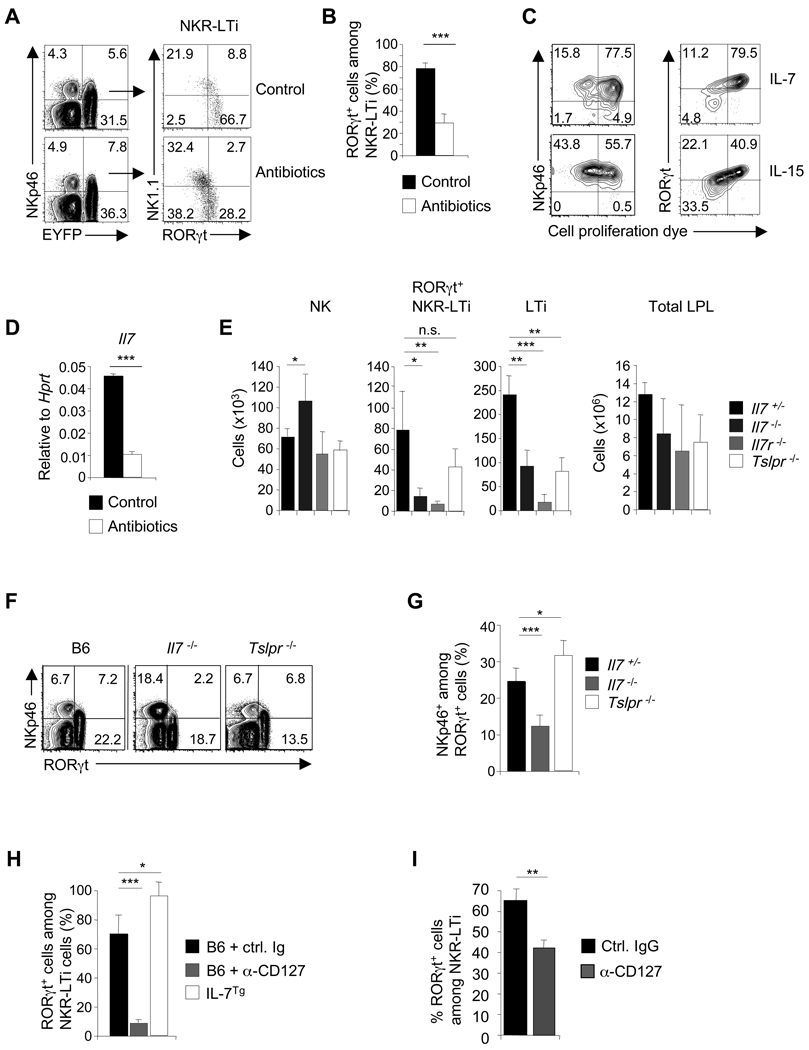
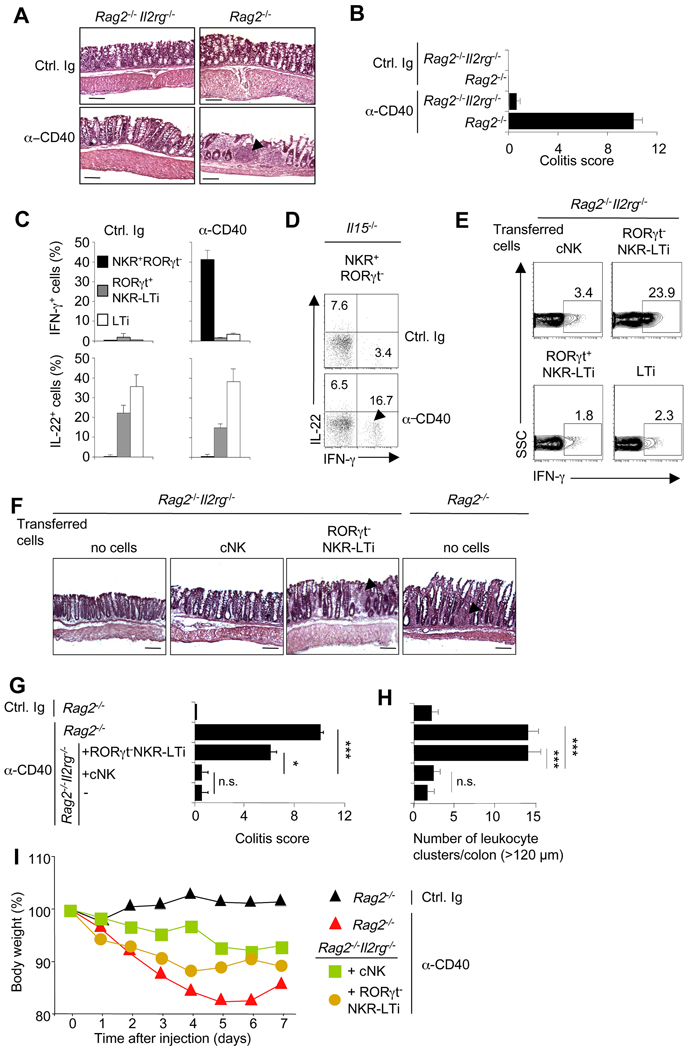
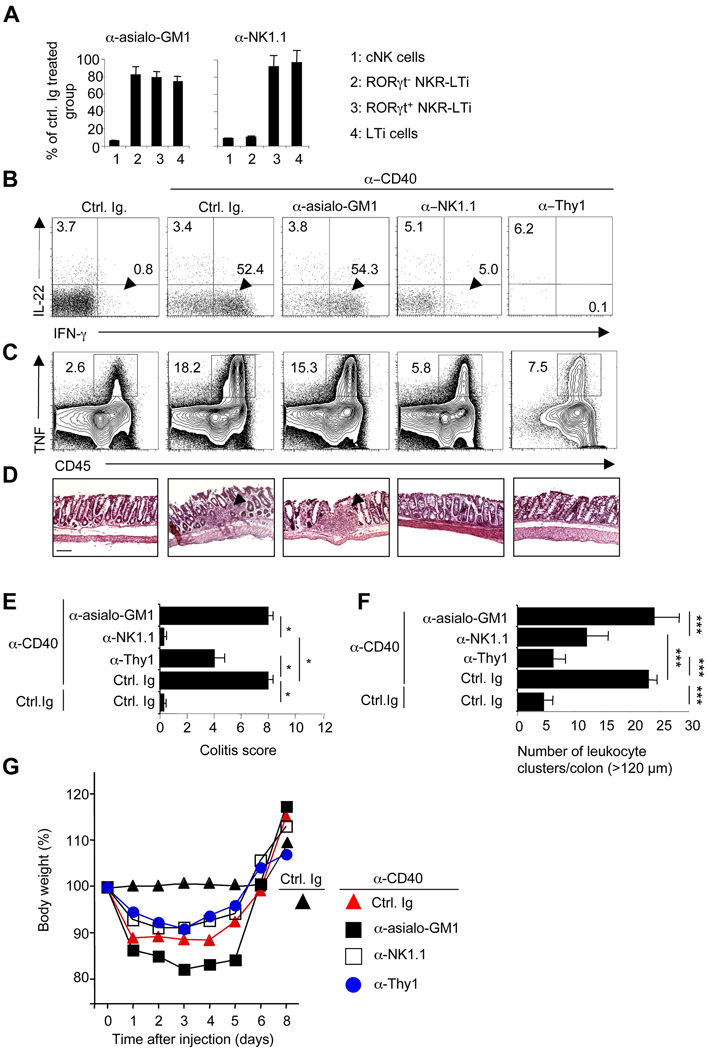
Whether the recently identified innate lymphocyte population coexpressing natural killer cell receptors (NKRs) and the nuclear receptor RORγt is part of the NK or lymphoid tissue inducer (LTi) cell lineage remains unclear. By using adoptive transfer of genetically tagged LTi-like cells, we demonstrate that NKR⁻RORγt(+) innate lymphocytes but not NK cells were direct progenitors to NKR(+)RORγt(+) cells in vivo. Genetic lineage tracing revealed that the differentiation of LTi-like cells was characterized by the stable upregulation of NKRs and a progressive loss of RORγt expression. Whereas interleukin-7 (IL-7) and intestinal microbiota stabilized RORγt expression within such NKR-LTi cells, IL-12 and IL-15 accelerated RORγt loss. RORγt(+) NKR-LTi cells produced IL-22, whereas RORγt⁻ NKR-LTi cells released IFN-γ and were potent inducers of colitis. Thus, the RORγt gradient in NKR-LTi cells serves as a tunable rheostat for their functional program. Our data also define a previously unappreciated role of RORγt⁻ NKR-LTi cells for the onset or maintenance of inflammatory bowel diseases.


Figures

Figure 1
Figure 1. NKp46+RORγt+ cells are derived from NKp46RORγt+ precursors
(A) Flow cytometry analysis of NKp46 and RORγt (EGFP) expression by CD3CD19 lymphocytes from the indicated organs of Rorcgfp/+ mice. Numbers represent percent cells in quadrant. n.d.: not done. (B) 2×10⁴ of the indicated cell populations from the small intestine of Rorcgfp/+ mice (H-2b) were transferred into Rag2−/−Il2rg−/− mice (H-2d). At the indicated timepoints, donor-derived lymphocytes were analyzed for NKp46 and RORγt (EGFP) expression. Numbers represent percent cells in quadrant. (C) Sorted cell populations from the intestinal lamina propria of Rorcgfp/+ mice were cultured with and without feeder cells for seven days in vitro. Contour plots show NKp46 and RORγt (EGFP) expression and were electronically gated on CD45+ cells. Numbers represent percent cells in quadrant. Data are representative of three (C) or four (A,B) independent experiments.
Figure 2
Figure 2. Genetic lineage tracing reveals progressive loss of RORγt in NKR-LTi cells
(A) Flow cytometry analysis of NKp46 and RORγt-fate map (EYFP) in CD3CD19 lymphocytes from the indicated organs. Numbers represent percent cells in each quadrant. (B) Lymphocytes from the indicated organs of RORγt-fate map mice were stained with antibodies specific for CD3, CD19, NKp46 and RORγt or isotype control antibody. Histograms are electronically gated on CD3CD19 cells and represent staining of the indicated cell populations with RORγt (grey) or isotype control Ab (open). Numbers indicate percentages of RORγt+ cells. (C) Percentage (± SEM, n=7) of RORγt+ cells among all NKR-LTi cells in the indicated organs. (D) Splenocytes from RORγt-fate map mice were stained for CD3, CD19, NKp46 and CD4. Density plots are electronically gated on CD3CD19 cells and depict the proportion of CD4 and NKp46 expressing cells within the indicated cell populations. (E) Splenocytes from RORγt-fate map mice were stained for CD3, CD19, NKp46, CD4 and RORγt (grey) or with isotype control antibody (open). Histograms are gated on CD3 CD19 cells and depict expression of RORγt within CD4+ and CD4 NKR-LTi cells. Numbers indicate percentages of RORγt+ cells. (F) Splenocytes from RORγt-fate map mice were stained for CD3, CD19, NKp46, CD25, CCR6 and RORγt. Density plotes are electronically gated on CD3CD19 cells and show co-expression of RORγt and CD25 (top) or CCR6 (bottom). (G) 2×10⁴ splenic CD4+RORγt+ NKR-LTi cells of Rorcgfp/+ mice (H-2b) were transferred into Rag2−/−Il2rg−/− mice (H-2d). Two weeks later, CD4 and RORγt (EGFP) expression by donor-derived cells (H-2b) was determined. Numbers represent percent cells in quadrants. (H) Splenocytes from CD4-fate map mice were stained for CD3, CD19, NKp46 and CD4. Contour plots are gated on CD3CD19 cells and depict expression of NKp46 and CD4 or CD4-fate map (EYFP). Histogram shows the percentage of NKp46+CD4fm+ cells expressing CD4. Data are representative of ten (A), seven (C), four experiments (B, D–G) or two experiments (H).
Figure 3
Figure 3. Commensal microflora and IL-7 stabilize RORγt expression in NKR-LTi cells
(A,B) Lymphocytes from the small intestine of conventional and antibiotic-treated RORγt-fate map mice were stained with antibodies specific for CD3, CD19, NKp46, NK1.1 and RORγt. Contour plots (left) are electronically gated on CD3CD19 cells and depict expression of RORγtfm (EYFP) and NKp46. Dot plots (right) are electronically gated on NKR-LTi cells and represent staining for RORγt and NK1.1. Numbers indicate percentages. (B) Percentage (± SEM, n=3) of RORγt+ cells among NKR-LTi cells in conventional and antibiotic-treated RORγt-fate map mice. (C) Highly purified RORγt+ NKR-LTi cells from the small intestine were labelled with a cell proliferation dye and cultured in IL-7 or IL-15 for six days. Cells were stained for NKp46 and RORγt. Numbers indicate percentages in each quadrant. (D) Quantitative RT-PCR analysis of Il7 expression in small intestine of control mice and germ-free mice. (E) Absolute cell numbers (± SD, n=5) of the indicated cell populations in the lamina propria of the small intestine. (F,G) Lymphocytes of the small intestine were stained with antibodies specific for CD3, CD19, NKp46 and RORγt. Contour plots are electronically gated on CD3CD19 cells and numbers indicate percentages within quadrants (F). (G) Percentage (± SD, n=5) of NKp46+ cells among all RORγt+ cells. (H) 2×10⁴ highly purified RORγt+ NKR-LTi cells (CD45.1) from the small intestine were transferred into groups of B6 (CD45.2) or IL-7Tg mice (CD45.2). B6 mice were treated with IL-7Rα antibodies or control Ig. Percentages (± SEM, n=3) of RORγt+ cells among donor-derived cells (CD45.1+) were determined two weeks after transfer. (I) RORγt-fate map mice were treated with either IL-7Rα antibodies or control Ig. Percentages (± SEM, n=3) of RORγt+ cells among NKR-LTi cells were determined after six days. Data are representative of at least three independent experiments.
Figure 4
Figure 4. Human IL-22-producing cells depend on IL-7 for their development
(A,B) Quantitative RT-PCR analysis of IL22 and RORC expression by the indicated, populations from human tonsils (A) or peripheral blood (B). Stage 1: CD34+CD117 CD94, Stage 2: CD34+CD117+CD94, Stage 3: CD34CD117+CD94, Stage 4: CD34CD117+CD94+. (C,D) Mononuclear cells were stained with antibodies specific for the indicated markers and for CD3 and CD19. Dot plots (C) were electronically gated on CD3CD19 cells. Contour plots (D) exclude all CD3+ and CD19+ cells and are electronically gated on CD34+ (stage 1 and stage 2) or CD34 cells (stage 3 and stage 4). Numbers indicate percentage of cells within the adjacent gates. Data are representative of two independent experiments.
Figure 5
Figure 5. RORγt expression within NKR-LTi cells determines distinct functional fates
(A) Splenocytes from RORγt-fate map mice were stained for CD3, CD19, NKp46, IL-12/23Rβ1 (grey) or isotype control antibody (open). Histograms depict electronic gating on the indicated cell populations after exclusion of CD3+ and CD19+ cells. (B,C,G,H) Quantitative RT-PCR analysis of the expression of Il23r (B,G) and Il12rb2 (C,H) in sorted cell populations from spleen (B,C) or colon (G,H) of RORγt-fate map mice. (D,E) Cytokine production of highly purified cell populations from spleens of RORγt-fate map mice (D) or Rorcgfp/+ mice (E) stimulated for 24 hours with the indicated cytokines. Contour plots depict staining with anti-IL-22 and anti-IFN-γ. The numbers indicate the percentage of cells in each quadrant. (F) Groups of RORγt-fate map mice were injected with LPS. 18 hours later, splenocyte suspensions were stained with antibodies specific for CD3, CD19, NKp46, CD4, IL-22 and IFN-γ. Contour plots are electronically gated on the indicated cell populations after exclusion of all CD3+ and CD19+ cells. Numbers indicate percentage of cells in each quadrant. (I) Highly purified lamina propria lymphocytes from the colon of RORγt-fate map mice were cultured for 24h in IL-23. Contour plots depict expression of IFN-γ and RORγt. Numbers indicate the percentage of cells in each quadrant.
Figure 6
Figure 6. RORγt NKR-LTi cells induce CD40-triggered colitis
(A–D) Groups of Rag2−/−, Il15−/− and Rag2−/−Il2rg−/− mice were injected with control Ig or anti-CD40 and were analyzed seven days later. (A) Histological analysis of colon sections (H&E stain). Arrowhead points to a cluster of infiltrating leukocytes that can only be found in mice with colitis. Bar = 100µm. (B) Clinical colitis score (± SEM; n=5). (C,D) Lamina propria lymphocytes from colon were stained for CD45, NKp46, RORγt, IL-22 and IFN-γ. (C) Bar diagrams show percentages (± SEM; n=5) of IFN-γ or IL-22-producing cells within the indicated lymphocyte populations. (D) Dot plots depict expression of IFN-γ and IL-22 by NKR+RORγt cells. Numbers indicate the percentage of cells in each quadrant. (E–I) 5×10⁴ highly purified cells from the intestine of RORγt-fate map mice (H-2b) were transferred into Rag2−/−Il2rg−/− mice (H-2d). (E) Five days after transfer, mice were injected with anti-CD40. Seven days after CD40 injection, donor cells were analyzed for IFN-γ production. Numbers indicate percentage of IFN-γ+ cells. (F–I) Two weeks after transfer mice were injected with control Ig or anti-CD40 and anlyzed seven days later. (F) Histological analysis of colon sections (H&E stain). Arrowheads point to clusters of infiltrating leukocytes that can only be found in mice with colitis. Bar = 100µm. (G) Clinical colitis score (± SEM; n=3). (H) Absolute numbers (± SEM; n=3) of leukocyte clusters (> 120 µm) per colon. (I) Weight as a percentage of the initial weight at day 0. Data represents the mean weight and is pooled from three independent experiments (n=5 mice per group). Error bars were omitted for clarity. Data represent the results of three independent experiments.
Figure 7
Figure 7. Depletion of RORγt NKR-LTi cells ameliorates colitis
(A) Groups of RORγt-fate map were treated twice with the indicated antibodies. Two days after the last injection, intestinal lamina propria cells were stained with NKp46, RORγt, CD3 and CD19. After exclusion of all CD3+ and CD19+ cells, the indicated populations were quantified. The data represents the percentage (± SD; n=5) of remaining cells compared to control Ig-treated groups. (B–G) Groups of Rag2−/− mice were treated with the indicated antibodies and injected with control Ig or anti-CD40. Seven days later, lamina propria lymphocytes from colon were stained for CD45, NKp46, RORγt, IL-22, IFN-γ or TNF. The dot plots (B) represent the analysis of CD45+NKp46+RORγt cells that contain both cNK cells and RORγt NKR-LTi cells. Numbers represent percentage of cells in the respective quadrants. The contour plots (C) represent the analysis of all CD45+ cells. Numbers next to the areas indicate percentage of TNF+ cells within gates. (D) H&E staining of sections from the distal colon. Arrowheads point to inflammatory foci. Bar = 100 µm. (E) Clinical colitis score (± SEM, n=3). (F) Mean numbers (±SEM, n=3) of leukocyte clusters (> 120 µm) per colon. (G) Weight as a percentage of the initial weight at day 0. Data represents the mean weight and is pooled from three independent experiments (n=5 mice per group). Error bars were omitted for clarity.

Comment in

Similar articles

Cited by

References

    1. Aloisi F, Pujol-Borrell R. Lymphoid neogenesis in chronic inflammatory diseases. Nat Rev Immunol. 2006;6:205–217. - PubMed
    1. Bogunovic M, Ginhoux F, Helft J, Shang L, Hashimoto D, Greter M, Liu K, Jakubzick C, Ingersoll MA, Leboeuf M, et al. Origin of the lamina propria dendritic cell network. Immunity. 2009;31:513–525. - PMC - PubMed
    1. Bouskra D, Brezillon C, Berard M, Werts C, Varona R, Boneca IG, Eberl G. Lymphoid tissue genesis induced by commensals through NOD1 regulates intestinal homeostasis. Nature. 2008;456:507–510. - PubMed
    1. Buonocore S, Ahern PP, Uhlig HH, Ivanov II, Littman DR, Maloy KJ, Powrie F. Innate lymphoid cells drive interleukin-23-dependent innate intestinal pathology. Nature. 2010;464:1371–1375. - PMC - PubMed
    1. Cella M, Fuchs A, Vermi W, Facchetti F, Otero K, Lennerz JK, Doherty JM, Mills JC, Colonna M. A human natural killer cell subset provides an innate source of IL-22 for mucosal immunity. Nature. 2009;457:722–725. - PMC - PubMed

Publication types

MeSH terms