

Review
doi: 10.1016/j.mric.2010.08.013.
Quantification of liver fat with magnetic resonance imaging
Affiliations
- PMID: 21094444
- PMCID: PMC3002753
- DOI: 10.1016/j.mric.2010.08.013
Item in Clipboard
Review
Quantification of liver fat with magnetic resonance imaging
Magn Reson Imaging Clin N Am.
2010 Aug.
Abstract
Intracellular fat accumulation is common feature of liver disease. Intracellular fat (steatosis) is the histologic hallmark of nonalcoholic fatty liver disease but also may occur with alcohol abuse, viral hepatitis, HIV and genetic lipodystrophies, and chemotherapy. This article reviews emerging MR imaging techniques that attempt to quantify liver fat. The content provides an overview of fatty liver disease and diseases where fat is an important disease feature. Also discussed is the current use and limitation of nontargeted biopsy in diffuse liver disease and why quantitative noninvasive biomarkers of liver fat would be beneficial.
Copyright © 2010 Elsevier Inc. All rights reserved.
Figures
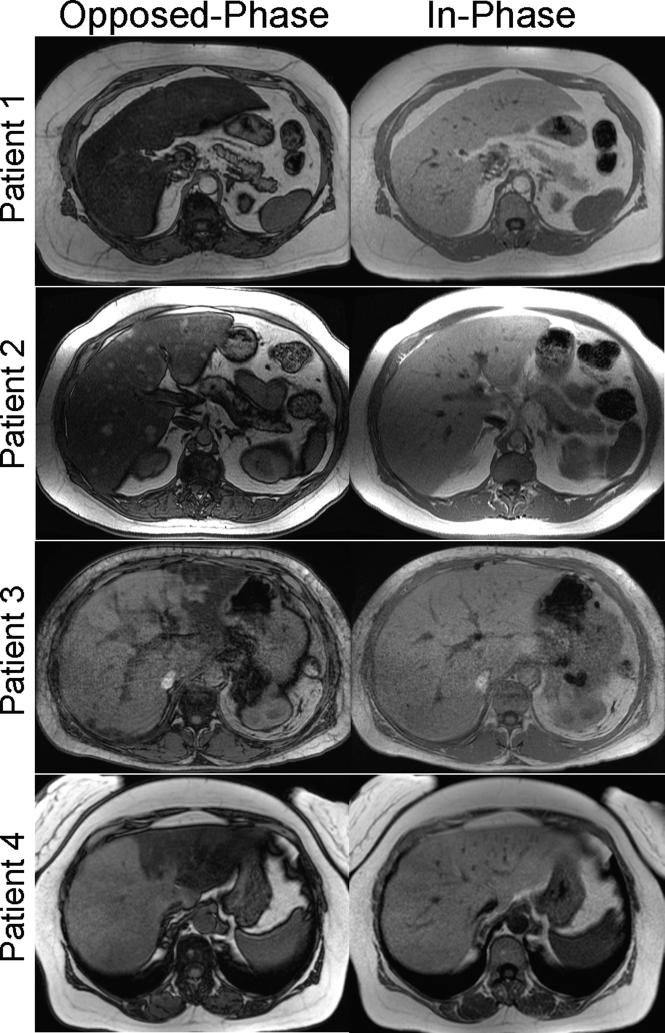
Conventional in-phase and opposed-phase (IOP) imaging is a well-established qualitative method for detection and characterizing fat within the liver. Examples of IOP imaging in patients with steatosis demonstrate a variety of patterns, including diffuse (top row), diffuse with mass-like sparing (second row), geographic steatosis (third row) and ever lobar (bottom row). Other patterns including focal mass like steatosis and perivascular distributions have also been described.
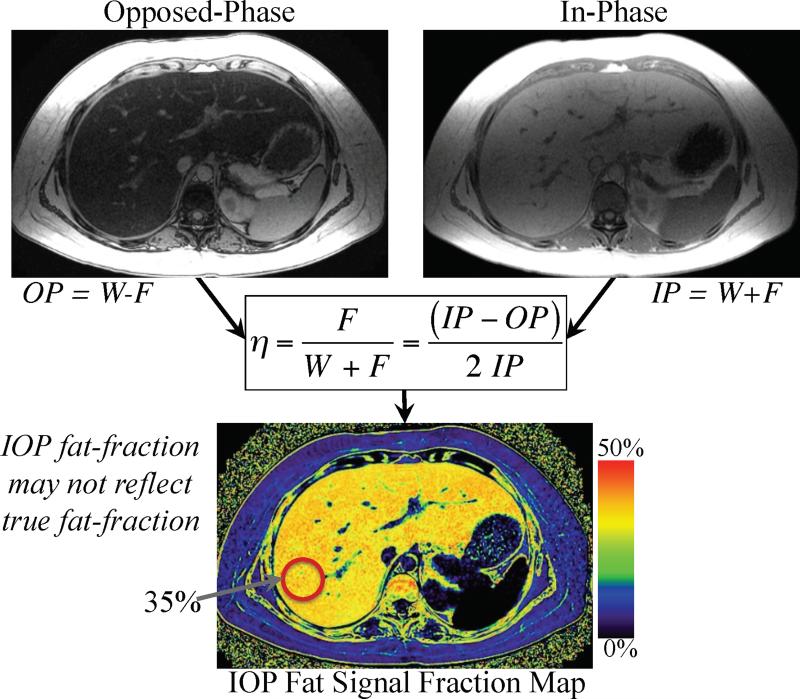
Fat signal fraction maps with dynamic range of 0-50% can be calculated on a pixel-by-pixel basis using conventional IOP imaging using equation 2. Such IOP fat-signal maps do not accurately reflect the concentration of fat within the liver unless all confounding factors are addressed.
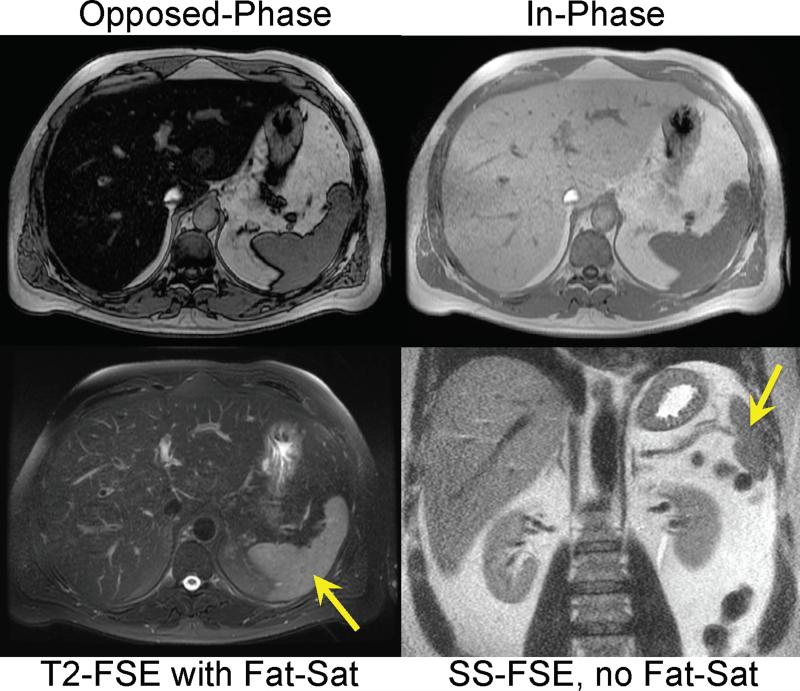
T2 weighted imaging with (bottom left), and without (bottom right), fat saturation can be used to detect steatosis. When no fat-saturation is used, the liver is relatively bright compared to the spleen (arrow). When steatosis is present, the signal intensity of the liver drops because the fat-saturation pulse suppresses the signal from fat within the liver. Note the relative signal intensity of fat relative to the spleen in the fat-saturated image. IOP imaging (top row) demonstrates marked signal dropout on opposed-phase imaging indicating the presence of steatosis.
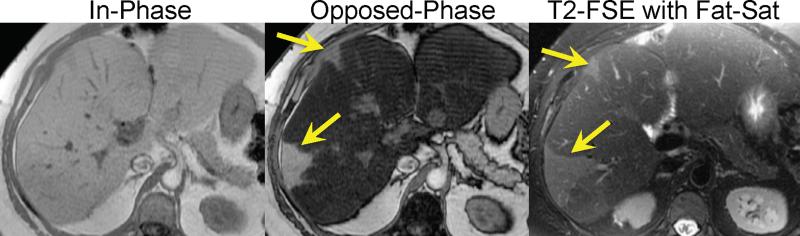
IOP imaging demonstrates steatosis with regions of geographic sparing (arrows) in a patient with NAFLD. Fat-saturated T2 weighted imaging shows diffuse decrease in signal in the liver in regions with fat accumulation. Regions of geographic sparing are unaffected by the fat-saturation pulse and therefore have higher relative signal intensity compared with regions of steatotic liver.
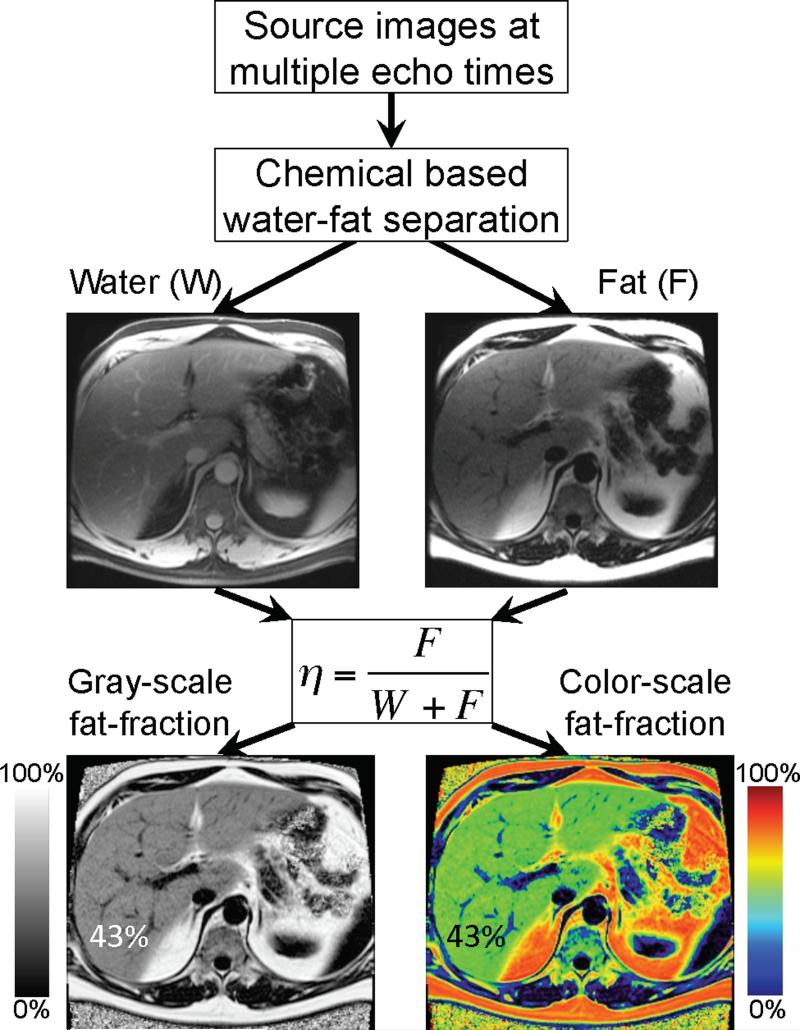
Fat signal fraction maps with dynamic range of 0-100% can be calculated on a pixel-by-pixel basis using equation 1, when chemical shift based water-fat separation methods are used to provide separate water-only and fat-only images. The fat signal fraction map does not accurately reflect the concentration of fat within the liver unless all confounding factors are addressed.
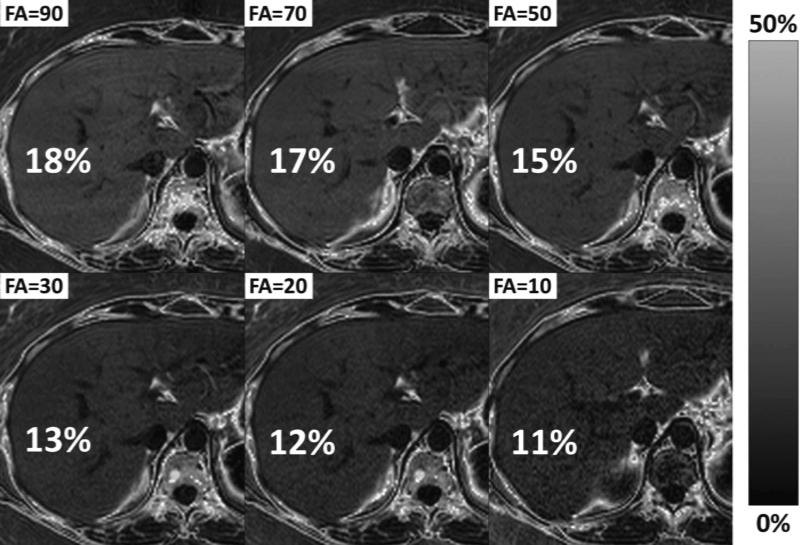
Differences in T1 between water and fat will lead to bias if the image acquisition is T1 weighted. Most MRI methods used to acquire fat-fraction images use gradient echo methods, which T1 weighted using typical flip angles. Since the T1 of fat is shorter than the water signal in the liver, the use of T1 weighted imaging will result in an apparent fat-fraction greater than the true fat-fraction. Reducing the flip angle can minimize T1 bias, although at a cost of reduced SNR performance. It is important to avoid T1 bias – otherwise the apparent fat-fraction will depend on image parameters such as TR and flip angle, and it is difficult to compare results using different protocols or different scanners. This example of MRI-M demonstrates how reducing the flip angle reduces the T1 bias (true PDFF ≈ 11%), although also degrades SNR performance.
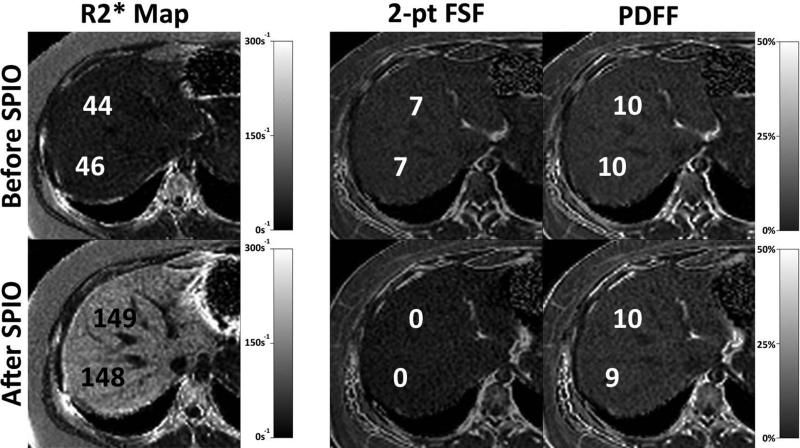
T2* correction is important in the presence of iron overload. The top row shows the PDFF map measured using the MRI-M method (right) before (top row) and after (bottom row) the injection of intravenous super paramagnetic iron oxides (SPIO) (Feridex, Bayer Pharmaceuticals, Wayne, NJ). SPIOs rapidly accumulate in the Kupfer cells within the liver and simulate iron overload from hemosiderosis and serve as an excellent model of iron overload in the liver. The R2* maps on the left demonstrate the increase in R2* from approximately 45s-1 (T2*=22ms) to 148s-1 (T2*=6.8ms) resulting from the SPIOs. No change in the PDFF is seen using the MRI-M method, which uses T2* correction, compared with the fat signal fraction (FSF) measured with 2-point IOP imaging (equation 2). Large changes in the apparent fat fraction are seen with 2-point IOP imaging, even though the true fat concentration in the liver is identical, after the injection of SPIOs.
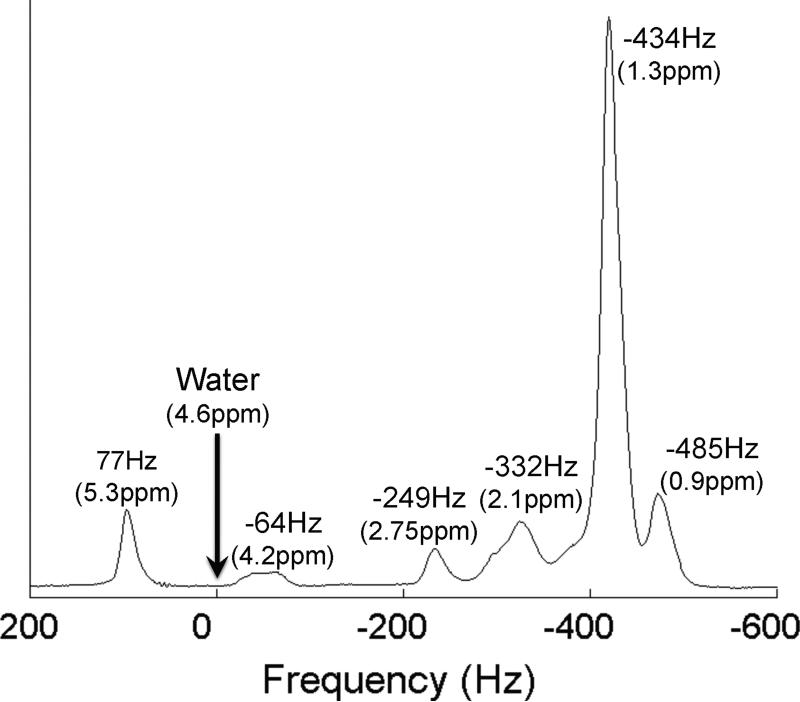
Single voxel MR spectrum of vegetable oil at 3.0T demonstrates the spectral complexity of fat. Triglycerides such as those in human liver fat have at least 6 identifiable peaks at clinical field strengths, similar to those shown in this figure. Methods such as IOP imaging and chemical shift based water-fat separation methods that model fat as a single NMR peak at -434Hz (-217Hz at 1.5T) will inaccurately estimate the concentration of fat within tissue if all peaks are not included in signal measurements. The frequencies that are shown present the chemical shifts of the different peaks at 3.0T relative to water.
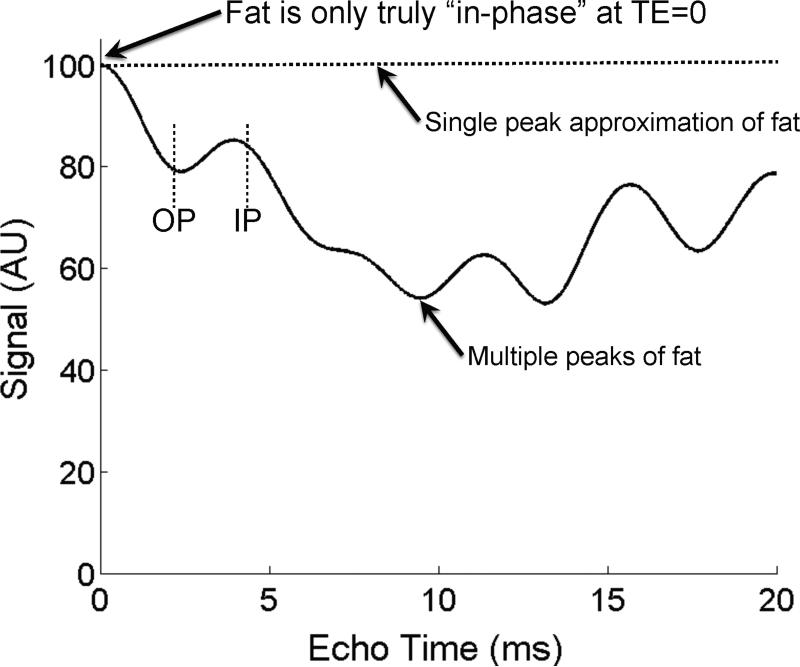
Fat is only truly “in-phase” when TE=0, or at a spin-echo. This occurs because fat has multiple spectral peaks that interfere with one another in a complex pattern with increasing TE. This effect is shown in a simulation of the signal from pure fat, in the absence of T2* decay, and at 1.5T. Large drops in signal, up to 50% will occur (near TE=10ms) because of this interference. Therefore, methods that attempt to measure fat concentration must consider the spectral complexity of fat. In addition, methods that attempt to measure T2* decay in the presence of fat must also consider fat's spectral complexity. The interference of fat with itself leads to highly inaccurate measurements of T2*. As a result, the terminology “in-phase” and “opposed-phase” lose their meaning because of the spectral complexity of fat. Conventional in-phase (IP) and opposed phase (OP) echo times are shown for reference.
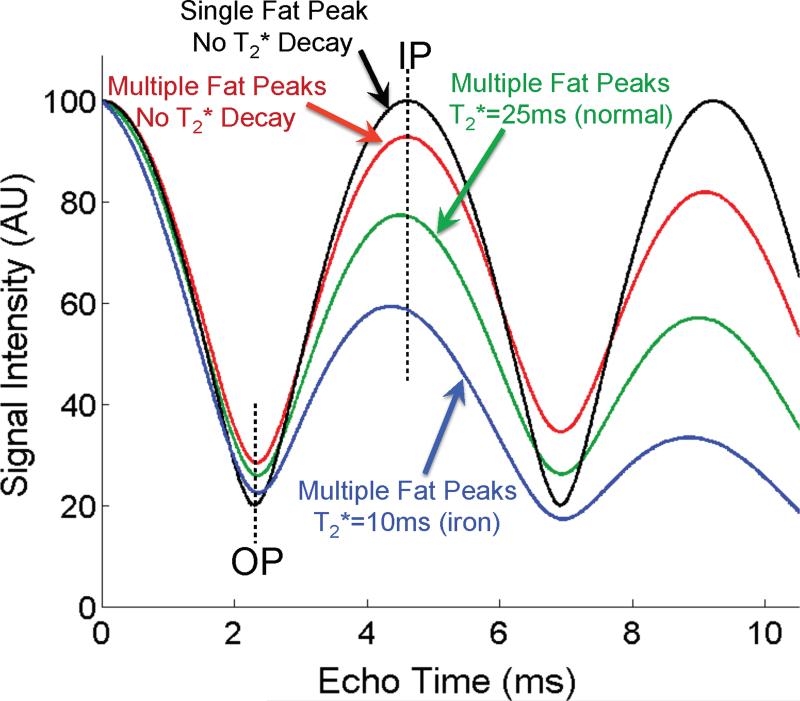
T2* decay and the spectral complexity of fat corrupt the ability in-phase and opposed phase imaging to quantify fat. Four simulations are shown for 40% fat at 1.5T, plotting: 1. “ideal” model of water and fat with single peak model and no T2* decay (black), 2. complex spectrum of fat with no T2* decay (red), 3. complex spectrum of fat with normal T2* decay (=25ms) (green), and 4. complex spectrum of fat with T2*=10ms to simulate iron overload. These plots indicate very large deviations from the expected signal pattern (black curve) demonstrating explicitly how T2* decay and the spectral complexity of fat corrupt the ability of IOP imaging to quantify fat. Erroneous estimates of fat fraction will occur without considering these important confounding factors.
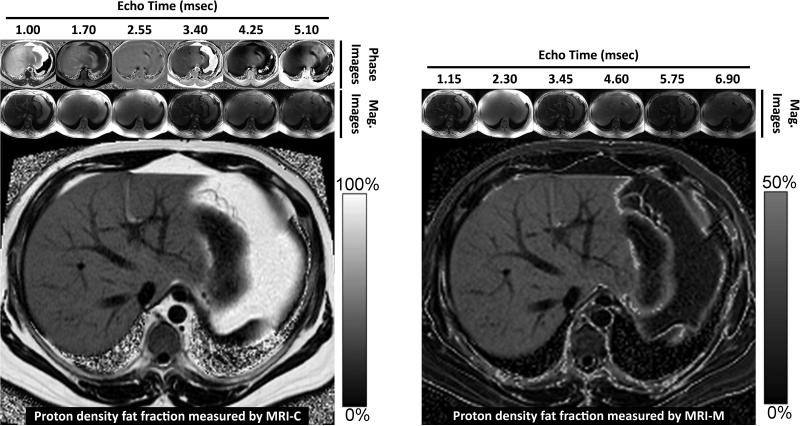
PDFF images acquired using MRI-M (right) and MRI-C (left) in a patient with severe steatosis demonstrate excellent agreement both qualitatively and quantitatively for fat within the liver. Both methods generate PDFF images using fundamentally different approaches: MRI-M uses magnitude source images acquired at six different echo times to generate a PDFF image with dynamic range of 0 to 50%, which spans the relevant dynamic range of hepatic fat content encountered clinically. MRI-C uses complex (magnitude and phase) source images acquired at six echo times to generate a PDFF image with dynamic range of 0 to 100%. Source magnitude images for MRI-M and source complex images for MRI-C are shown along the top. Notice that adipose tissue outside the liver exceeds the 0-50% PDFF dynamic range of MRI-M and so appears dark on the corresponding PDFF map.
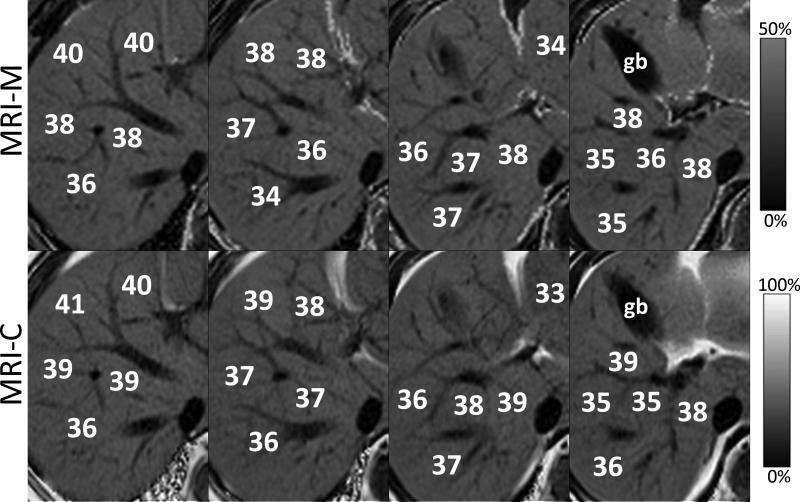
Magnified MRI-M (top row) and MRI-C (bottom row) from four adjacent slices demonstrate excellent qualitative agreement in the appearance and quantitative agreement in PDFF measurements, in a patient with fatty liver. MRI-M and MRI-C images acquired in the same patient at 3T. gb =gall bladder.
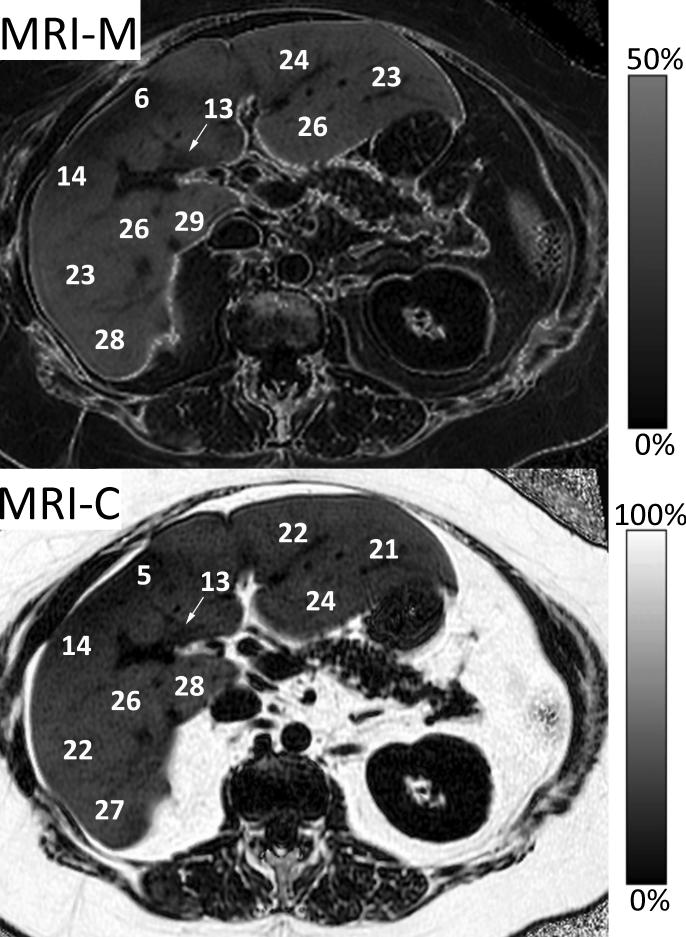
MRI-M (top) and MRI-C (bottom) PDFF images acquired at 3T in a patient with heterogeneous liver fat show excellent qualitative agreement and quantitative agreement. A wide range of PDFF values from approximately 5% to 29% also underscores the advantages of volumetric imaging methods that assess the entire liver, unlike MRS or biopsy.
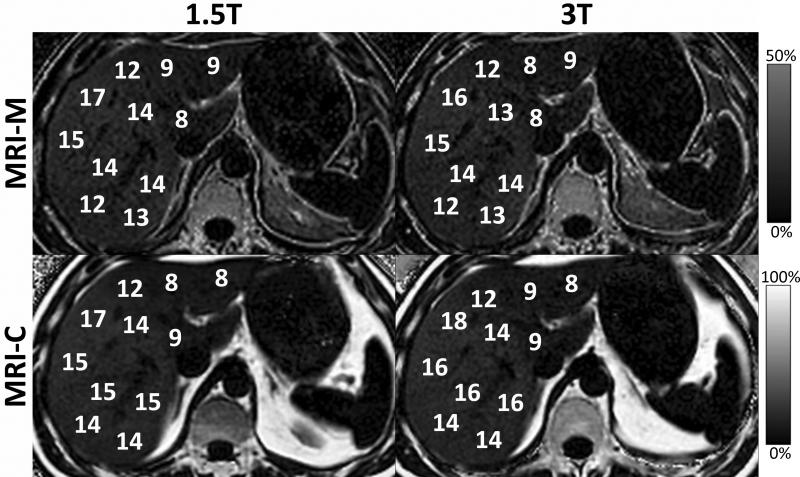
Field strength is not an independent confounding factor for quantification of fat. Although T1 and T2* change with field strength as well as the chemical shift, correction for these confounding factors shows no change in PDFF measured between 1.5T and 3T using either MRI-C or MRI-M. This demonstrates that field strength is not a factor that affects fat-fraction, independently.
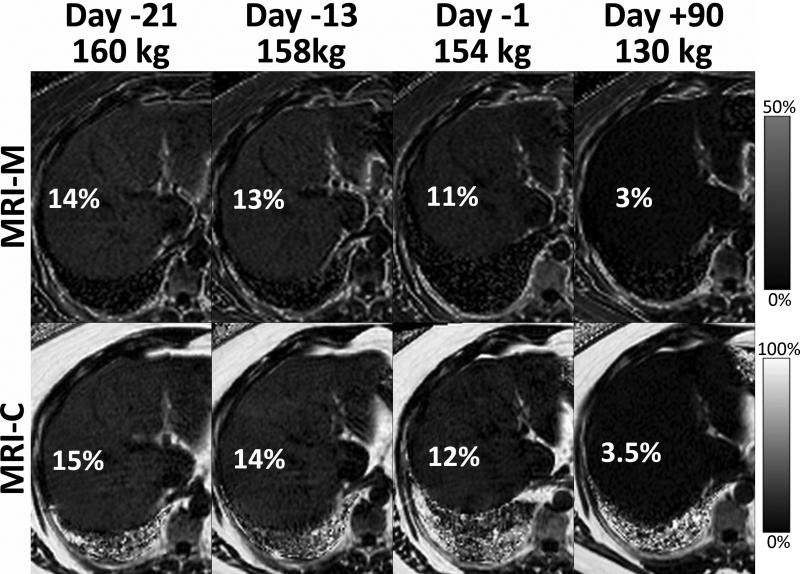
Serial MRI exams can be used to demonstrate meaningful changes in liver fat during weight loss in an obese patient who underwent laparoscopic gastric banding (LAGB). In this patient, MRI-M and MRI-C PDFF maps obtained 21 days, 13 days and 1 day before LAGB and 90 days after LAGB are shown. A modest decrease in PDFF was seen during a very low calorie liquid diet, and near complete resolution of liver fat was seen three months after LAGB. In this patient, a 30kg weight loss resulted in resolution of liver fat to normal levels.
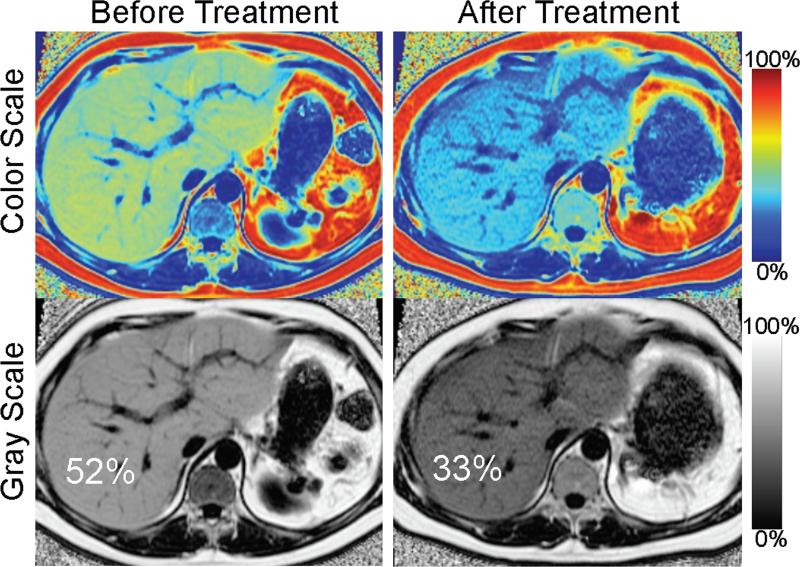
Serial liver MRI exams can be used to demonstrate changes in liver fat. Serial PDFF maps obtained with MRI-C were acquired in a 41 year old male with insulin resistance and recalcitrant hypertriglyceridemia undergoing plasmopheresis and on multiple drugs to lower serum triglycerides. Follow-up MRI demonstrates a large decrease in the concentration of fat (from 52% to 33%), and marked decrease in the size of the liver. This example demonstrates that fat-fractions greater than 50% do occur, and also compares the use of gray-scale and color-scale PDFF maps.
References
-
- Adams LA, Lymp JF, St Sauver J, et al. The natural history of nonalcoholic fatty liver disease: a population-based cohort study. Gastroenterology. 2005 Jul;129(1):113–121. - PubMed
-
- Adams LA, Waters OR, Knuiman MW, Elliott RR, Olynyk JK. NAFLD as a risk factor for the development of diabetes and the metabolic syndrome: an eleven-year follow-up study. Am J Gastroenterol. 2009 Apr;104(4):861–867. - PubMed
Publication types
MeSH terms
Grants and funding
LinkOut - more resources
Full Text Sources
Other Literature Sources
Medical
